Analysis of radar cross section assessment methods and parameters affecting it for surface ships
Análisis de Métodos de Evaluación de la Sección Transversal de Radar y de los Parámetros que Inciden en Ella para Buques de Superficie
Vladimir Díaz Charris1
José Manuel Gómez Torres2
Abstract
This article presents an analysis of the different modeling methods for predicting the radar cross section of surface ships. In the analysis, we studied the effect of different factors in vessel construction regarding the amount of electromagnetic energy returning to a radar source, such as the handling of shapes, use of different materials, and vessel size. We can see the different evaluation methods of the radar cross section and the software tools available to determine an appropriate methodology for adoption by the Colombian Navy and their subsequent integration with the design process and optimization of warships.
Key words: Radar Cross Section, RCS, vessels, RAM, absorbent, prediction, Navy.
Resumen
En este artículo se presenta un análisis de los diferentes métodos de modelado para la predicción de la sección transversal de radar (RCS) de buques de superficie. Dentro del análisis, se estudia el efecto de los diferentes factores constructivos del buque sobre la cantidad de energía electromagnética que regresa a una fuente de radar, como son el manejo de formas, el uso de diferentes materiales y el tamaño del buque. Se aprecian los diferentes métodos de evaluación de la sección transversal de radar y las herramientas de software disponibles con el fin de determinar una metodología adecuada para su adopción por parte de la Armada de Colombia, y su posterior integración con el proceso de diseño y optimización de buques de guerra.
Palabras claves: Sección Trasversal de Radar, RCS, buques, RAM, absorbente, predicción, Armada.
Date Received: November 1st, 2011 - Fecha de recepción: 1 de Noviembre de 2011
Date Accepted: January 18th, 2012 - Fecha de aceptación: 18 de Enero de 2012
________________________
1Mechatronic Engineer, M.Sc.(c) Electronic Engineering, DIDESI Researcher, COTECMAR, Colombia. e-mail: vdiaz@cotecmar.com
2Naval Electronic Engineer, MSME & MSSE, DIDESI researcher, COTECMAR, Colombia. e-mail: jmgomez@cotecmar.com
............................................................................................................................................................
Introduction
For the design of warships and military aircraft it is very important to have tools to predict or estimate the Radar Cross Section (RCS) during the preliminary design phase because it is not economically viable to do so with models or demos. Thus, we get clear information for the design of shapes of low or high radar detection and what shapes are compatible with the structural and hydrodynamic requirements. From the study of the state-of-the-art of managing the RCS (Díaz, Domínguez, and Saravia, 2012), we identified the factors that most affect the RCS of ships and other military vehicles, as well as the most frequent techniques used for their reduction.Among the factors identified are size, shape, and the vehicle’s materials and coatings. Among the techniques for reducing the RCS, we identified the use of radarabsorbing materials (RAMs) and the managing of shapes (Shaping); they are shown in relation to the use of stealth technology (Stealth).
From identifying factors and techniques that influence RCS, different methods and simulation tools are explored to evaluate RCS of warships and investigate the relative impact of different factors and techniques described about their RCS, through experiment design.
Development
Radar Behavior
To analyze radar behavior, we used the radar equation relating the radar’s range to the transmission, reception, antennae, target, and environmental characteristics. This equation is used to determine the maximum range at which radar can detect a target and be useful to understand the factors affecting the performance of the radar (Skolnik, 2001).
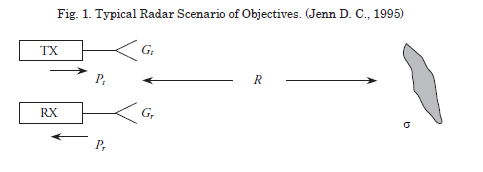
A typical scenario of a bistatic radar is shown in Fig. 1, where the TX box represents the radar transmitter, the RX box the radar receiver, while the gray object on the right represents the goal or target. Both transmitting and receiving antennae are closely located to each other; therefore, it is assumed that the range to the target is equal to R.
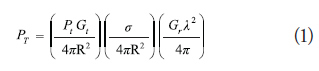
The simple radar equation is described below:
Where Pr is the power received by the radar in (watts). Pt is the transmission power in (watts). Gt is the Gain of the transmitting antenna. Gr is the gain of the receiving antenna, σ the radar cross section (RCS) (m2), λ the wavelength of the radar operating frequency (m), and R is the range between the radar and the target (m).
It takes into account that the first term in parentheses represents the power density of radar in the objective (watts/m2). The product of the first and the second terms in parentheses represents the power density in the radar receiver due to the reflection or scattering that occurs in the target. The third term in parentheses represents the amount of reflected power captured by the opening receiving antenna.
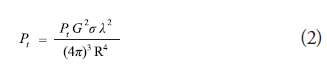
In the case of the mono static radar, where the radar uses the same antenna for transmission and reception, Gt is equal to Gr and by establishing Gt = Gr = G, the equation can be written as:
The radar’s maximum range, Rmax, is the distance beyond which the target cannot be detected. This occurs when the Pr received signal is equal to the minimum detectable Smin signal. Substituting Pr = Smin in equation (1.2) and rearranging terms, yields:
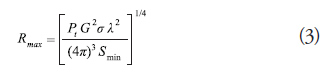
Although this form of radar equation (1.3) excludes many important factors and generally predicts high values for the maximum range, it represents the relationship between the maximum RCS radar and the target.
As shown in equation (1.3) of the radar, the RCS is a property of the object or target dispersing the radar signal, representing the magnitude of the radar signal echo returned by that object. It can be defined as:
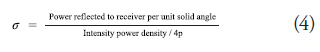
Clearly, the RCS of a target is a measure of the scattered power in a given direction when the target is illuminated by an incident wave normalized to the power density of the incident field. The purpose of normalization is to remove the effect of the range and, thus, obtain a value of SCR that is independent of the distance between the target and the light source (Garrido, 2000).
Some factors that determine the amount of electromagnetic energy returning to the source are (Maritime Safety Information, 2009):
• The material and geometry of the target in
which it is made.
• The absolute size of the target.
• Relative transmitter/receiver position to the target.
• The relative size of the target in relation to the
wavelength of the illuminating radar.
• The incidence angle, which is the angle at
which the radar sends waves to a particular
portion of the target that depends on the
shape and orientation of the target to the radar
source.
• The reflected angle, which is the angle at
which the reflected wave leaves the target and
is directly related to the angle of incidence.
• Signal strength of the radar transmitter.
• Distancebetween radar and target.
Frequency Behavior
To perform the prediction, it is necessary to know what the behavior of RCS in frequency reading is. There are three frequency regions in which a target RCS is quite different, as shown in Fig. 2. These regions are defined depending on the target size in terms of the incident wavelength as: low-frequency region or Rayleigh region, resonance region or Mie region, high-frequency region or optical region.
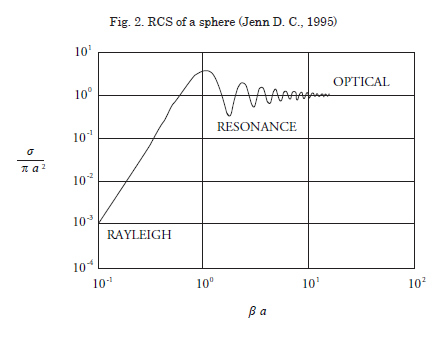
• Low-frequency region or Rayleigh (2π/λ< 1),
where the induced current in the body of the
target is approximately constant in amplitude
and phase.
• Resonance or Mie region (2π/λ≈1). The phase variation of the current through the body of the target is important and all parts contribute to the dispersion. Generally, λ against 2π/L
will fluctuate.
• High-frequency or Opticalregion (2π/λ>1). There are many cycles in the variation of the
current phase through the target body and,
consequently, the discrete field will be a highly
dependent angle (Jenn D. C., 1995).
Methods to predict RCS
Methods are available to make RCS predictions,such as methods of moments, finite difference, microwave optics, and method of optical physics where many disadvantages can be found in each of them in terms of high computation requirements and increased runtime to perform the prediction;described as the best option is RCS prediction in the optical physics method consuming the least amount of computational resources and with less complexity (Garrido, 2000). It is necessary to validate, in any case, the accuracy for ranges of frequencies of interest and the size of the ships to consider.
Modeling and visualization of radar targets
Several types of modeling and visualization of radar exist such as geometric modeling of solids, modeling by borders, modeling by Curved Patches, and Modeling by Facets, which are techniques for predicting radar cross section that require a realistic model of the target to impose boundary conditions of the electromagnetic problem on its surface.
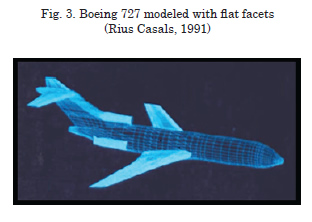
The most common method used today is modeling by borders through flat facets in which the modeled surface is more similar to the real and results in much higher prediction (Rius Casals, 1991).
The main drawback of modeling with flat facets is that the performance of the model is difficult when the radar target presents very complex surface shapes, as shown in Fig. 3, where the wings and aircraft turbines have hundreds of facets to achieve its real constitution.
To achieve a precise model, the facets should be approximated to the actual surface as much as necessary at the expense of raising the number of facets used. The large number of facets, each characterized by the spatial coordinates of its vertices, constitutes an extremely large amount of information to process, requiring a considerable computational effort even with high-frequency techniques, although much less than the level required by discretization with low-frequency methods.
Physical optical model
It is another of the techniques most commonly used today to predict cross section of complex radar targets and it is obtained by consistently adding the contributions of each of the illuminated areas (Garrido, 2000).
The method of modeling by facets allows easily adding the diffraction in edges by analyzing the wedges that form adjacent facets. These wedges may correspond to the edges of the real model, such as the trailing edge of the wings on an airplane or artificial edges due to the creation of facets of the real curved surface.
The main limitation of the geometrical optics approximation is to assume infinite frequency. The physical optics approximation introduces appropriate dependence on the frequency via the application of the theorem of equivalence: it calculates the fields radiated by the induced currents on the surface of the object. To find out about these the approximation of the tangent plane, it is used on the illuminated surface and assumed null in the shadow area. This is equivalent to performing the integral of radiation only on the illuminated surface disregarding hidden surfaces.
Because the physical optics method approximates the currents on the surface of the object, for currents that would be on an Infinite tangent plane, it correctly predicts the first-order reflection in large areas, while it incorrectly deals with the surfaces of small radius of curvature and the diffraction in edges and vertices. This provides good results with radar targets of large dimensions, in which the reflection on the surface of the fuselage is dominant.
Methods of reduction and control of RCS
Techniques and tactics are used to reduce RCS such as:
Management of Shapes
It is best done at the design stage to ensure no large angular sources of RCS like orthogonal corners. Subsequently, the reduction of micro-geometry techniques can be applied; it offers a reduction in RCS by eliminating or re-designing exposed subsystems to concentrate the radar signature in some directions under threat, leaving RCS low elsewhere. Careful design can substantially reduce RCS by using shaping, the preparation of surfaces, minimizing the number of openings, and contraction of weapons and sensors within the structure when not in use (AirPlane Design, 2011).
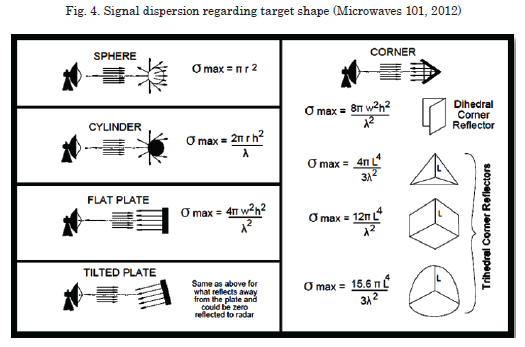
Fig. 4 describes the difference in the scattering of the radar signal in some types of shapes.
Radar absorbent material (RAM)
Radar-absorbing materials in the form of surface coating or structural materials play an important role in complementing or enhancing RCS reduction.Radar echo includes direct specular reflections, diffractions from edges, multiple reflections and drag waves, which propagate along the surface of the body and emerges at the opposite edge.
These materials are presented in many forms depending on the mode of application and on the place and environment in which they have to work. For example,aircraft materials will be resistant to erosion, differential pressure, and attacks, while ships have to work in aggressive marine environments and must withstand day-today operations therein.
There are radar absorbent panels that are easily transported and are designed to be temporarily affixed to the structure of the vessel; they absorb the radar energy in broadband. In addition, there are Radar-Absorbent layers lighter than the panels, the slabs of Radar absorbent, the absorbent materials in spray for difficult access areas or in those on which it is difficult to apply other types of materials like masts of vessels or air and gas intakes and outlets. These materials tend to be heavier than the prior. Light foams are also used in areas where transparency at the output of radar waves is necessary (domes, antennae, etc.) (Sahajanand, 2011) and radar reflective film used in aircraft crystals, helicopters and command bridges on ships that can be applied and replaced with ease.
When shapes can no longer be modified orwhen modifying them is an excessive cost, it is necessary to use radar-absorbing materials (RAM). With these, RCS and detection distance can be significantly diminished.For this reason, if the RCS of a typical frigatecan be 25,000 m2, a reductionof the RCS of the same frigateby 600 m2 is possible by using certain radar-absorbing materials.
In the design of these materials, we will have to consider the frequencies normally used by surveillance and lighting radars. In general, the 6-18 GHz band covers most of the known antivessel missile systems. However, on other platforms, like tanks, the frequency is about 98 GHz.
Passive Cancellation
It is a form by which its basic concept is to introduce a source echo whose amplitude and phase can be adjusted to cancel another echo of origin. This can be achieved by relatively simple objects, provided that a charge point is available that can be identified in the body, and the size and shape of the inner cavity can be designed to present optimal impedance at the opening. Unfortunately, for simple bodies, it is always extremely difficult to generate the unit of frequency required for these incorporated impedances and the reduction obtained for a frequency in the spectrum disappears quickly as frequency changes. In addition, typical weapons platforms have hundreds of wavelengths in size and hundreds of echo sources. It is clear that it is not practical to design a treatment of cancellation of passives for each of these sources. In addition, the cancellation can return to reinforcement with asmall change in the frequency or viewing angle. Consequently, passive cancellation for the most part has been ruled out as a useful technique in reducingRCS (Knott, Shaeffer, &Tuley, 2004).
Active Cancellation
Also known as the active load, active cancellation is even more ambitious than the passive load. In essence, the goal is to deliver radiation to coincide with the time at input pulse whose amplitude and phase cancels the reflected energy. This implies the goal being "smart" enough to detect the angle of arrival, intensity, frequency, and waveform of the incident wave.It should also be smart enough to know its own echo characteristics for that particular wavelength and angle of arrival fast enough to generate the waveform and frequency. This system must also be versatile enough to adjust and emit a pulse of amplitude and phase at the appropriate time. Obviously, the relative difficulty increases the active cancellation more frequently, as centers of dispersal of the in and out of phase with the smallest appearance changes and where dispersion patterns are more complex and, therefore, the active cancellation is best suited for low-frequency RCS reduction (Knott, Shaeffer, & Tuley, 2004).
Items to obtain an RCS minimum (Knott, Shaeffer, and Tuley, 2004)
a. Avoid creation of design with strong
characteristics to reflections in the direction of the
radar
• Use non-metallic materials
• Absorb instead of reflectthe radar energy
• Mask or cancel any remaining reflection
In creating the design, the following should be
considered:
• Avoid using large flat surfaces
• Avoid the curve of the exhaust surface and
other parts with concave shapes, or convex
shapes because they would be reflexive
• Avoid shape discontinuities such as corners
and abrupt change in the profile, blending and
smoothing all appendages and joints in the surface
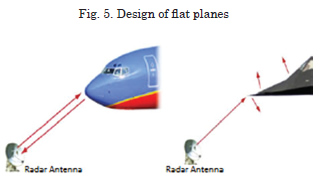
• Use Flat Panel Design (FPD), which consists of multiple surfaces that reflect each in a different direction and is less likely to betray the position. Fig. 5 shows the difference of the reflection of radar waves between commercial aircraft and modern combat aircraft.
• Incoming cavities or structures have a high RCS. Input and exhaust pipes must be moved to lower surfaces; in the case of vessels, where they can be detected far from the body.
• The radome or the antenna that stands out is a good source of reflection. Therefore, there is a need to use radio equipment in millimetric waves with size reduction on the antenna, as well as the use of flat arrangements, which have low RCS or use retractable antennas.
Other production factors that reduce RCS:
• Sides of the hull with a given outward angle
• Sides of the superstructure angled inwardly
• Bulkheads of the superstructure directed in
four preferred directions
• Avoid dihedrals and trihedrals
• Equipment on deck, as well as its base, must
be analyzed in such a way as to reflect the least
possible
• Elimination of candlesticks
Software
Within the search of computational tools that allow predicting RCS, various software have been developed for the military by companies in different countries like Germany, England and the United States.Below is a preview of the different software:
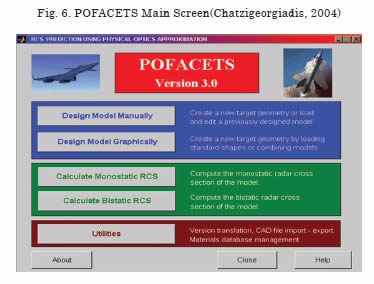
POFACETS 3.0: Software developed in 2000 under the Matlab platform, see Fig. 6; it allows approximation of RCS by using the physical optics method, via facets and models created manually or imported from existing CAD &RCS software; Cifer, Acads, Autocads (.Stl) and Pdetools MATLAB and can export files to and ACADS CIFE.
Allowing single static combinations, which could be described as a "transceiver" where the transmitting antenna is the same receiving the signal, and bistatic which is the combination of dual antenna, transmitter, and receiver.
Conversions among software versions, unit conversions, adding of new material data, among many other functions (Chatzigeorgiadis, 2004).
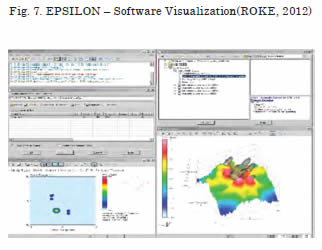
EPSILON
Software developed by ROKE in the UK in 2008, see Fig. 7. The most rigorous, accurate, and easy-touse RCS developer in its class. It is a software that predicts the RCS of large direct targets electrically from a computational model. EPSILON is a versatile tool, which approximates models of real-life scenarios, enabling customers to quickly evaluate signatures of targets and investigate how these signatures vary according to the shape and orientation of its design. This allows multiple designs to be evaluated for selection of the most cost-effective solution.It can also be embedded with simulation tools to offer high-performance approximations of radar targets for combat analysis. No other platform is required and it does not consume high computational resources. It uses the four methods described in this article and does not have limitations on maximum size, materials, and geometric models, compatible with CAD files, DXF, 3D Studio, and others (ROKE, 2012).
Typical applications for Epsilon include conventional RCS predictions, concept optimization of new platforms for stealth, improvement, and redesign of existing platforms, generation of models for physical simulation, and radar target imaging tests.
Other applications include major platforms such as aircraft, ships, tanks, spacecraft, secondary field equipment; trucks, generators, tents, weapons and weapon launch systems, antennae, buildings, and structures.
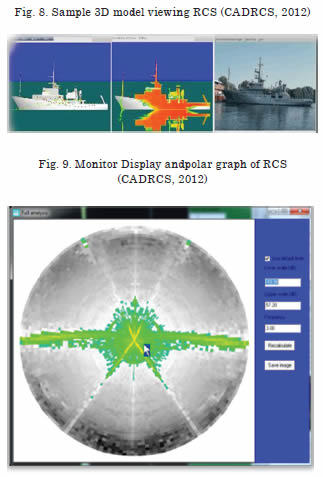
CADRCS
Software created in 1999 for RCS simulation. It is the only software that allows continuous evaluation of stealth ships, aircraft, and other military buildings during the construction phase. It provides high-resolution RCS simulation based on information from CAD files, see Fig. 8.
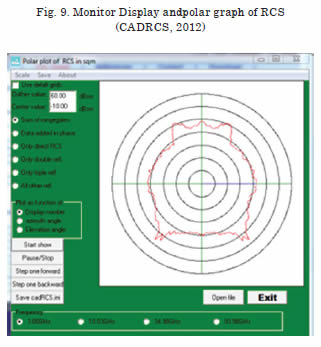
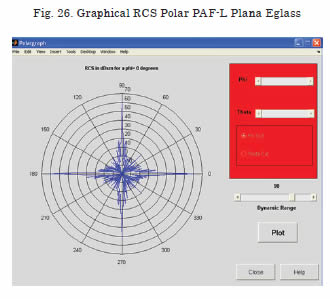
A friendly tool under the Windows operating system; based on graphical displays that allow precise enabling of areas reflected by radar waves and also provides images of mono-pulses, showing the objects that the radar is aimed at. It also displays the Polar view of RCS in square meters, with modification of factors that affect the signal, see Fig. 9. 3D calculation techniques used in this highly advanced software are based on 20-year experience in RCS measurements. The calculation time depends on the reflection profile of the object, the accuracy desired, and the RAM capacity of the PC. The theory used in CADRCS is unique and has not been published (CADRCS, 2012).
CST, Computer Simulation Technology Microwave Studio
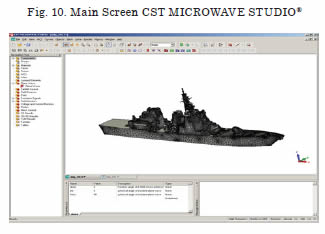
The developer of integral equations of CST Microwave Studio is a new module for approximation of 3D analysis of electrically large structures, see Fig. 10. It is based on the multilevel fast multipolemethod (MLFMM) and it is used for analysis of patterns for fittings and radiation of antennae. Typical applications include location of antennae in aircraft and cross section of radar objects of high dispersion calculations.
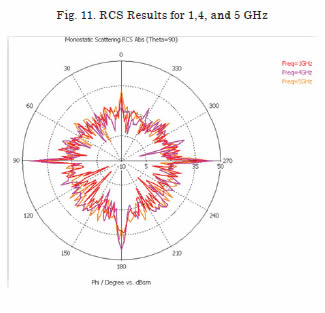
Within the results offered by CST are the polar graphs, as shown in Fig. 11 and output of text files for export to other kinds of software.
This software allows discretization by the moments method, integral formulation of surfaces combined with the MLFMM, surface mesh that generates less mesh cells than common volume methods, the computational effort with MLFMM is effectively proportional to the size of the problem.
Methodology
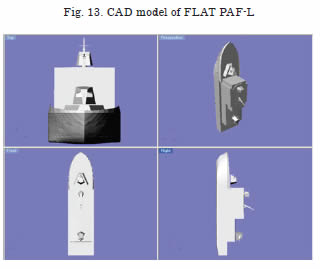
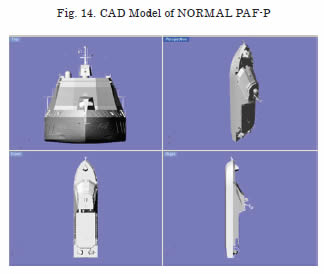
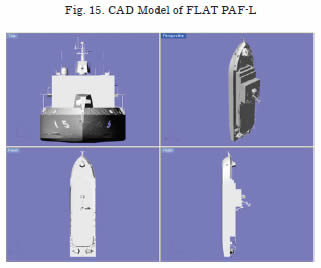
A series of tests are designed to validate the results given by the POFACETS, CADRCS software. The 3D models of ships made in the COTECMAR shipyard are used. Riverine support light Patrol boat (PAF-L) and Riverine support heavy Patrol boat (PAF-P), where modifications to the hull are made to vary the angle of incidence of the radar rays and simulation with different types of materials to observe the behavior of the RCS.
The models used are described below:
We describe as NORMAL the ship unmodified in shape, and as FLAT the ship with bulkheads and sections perpendicular to the surface.
The fact that the PAFP and PAFL have different displacements, allows noting the relationship between size and RCS and also observing its behavior.
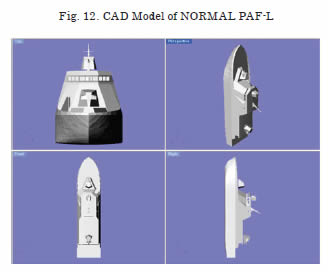
NORMAL PAF-L
Dimensions: Width: 7 m., Length: 30 m., Spot: 10.61 m.
FLAT PAF-L
Dimensions: Width: 7 m., Length: 30 m., Spot: 10.61 m.
To make the comparison among software, the same CAD models of the same vessel were simulated at the same frequency by selecting the Test Material REL. PER = 1in POFACETS,as well as in CADRCS.
Also, due to the unique format of each software to obtain data in flat files, a program in Labview, RCS2Polar.vi, was designed to be able to read and compare them. The software has two tabs of graphical and numerical comparison: Images and Data respectively, opening of two .txt files in parallel, one for the POFACETS software and the other for CADRCS, differentiating each graph in dB or m2 with a different color.
NORMAL PAF-P
Dimensions: Width: 9.7 m., Length: 41 m., Spot: 11.9 m.
FLAT PAF-P
Dimensions: Width: 9.7 m., Length: 41 m., Spot: 11.9 m.
Comparison among software is performed at different frequencies because these use different methods to calculate RCS, then each method, therefore, uses different techniques where the value of the frequency directly affects both precision of the result and simulation time. Here are some graphs of simulations at different frequencies 1-16 GHz with results given in dB.
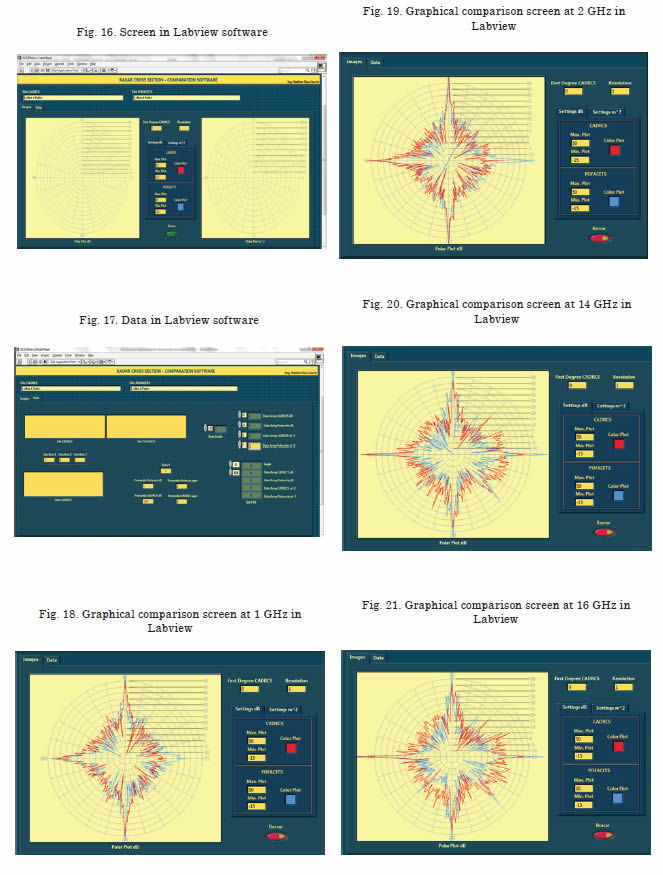
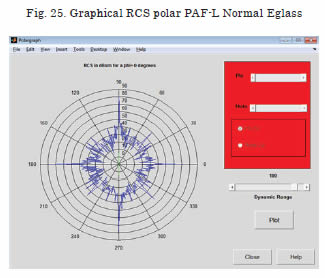
After various tests, we observed that in many angles of the ship a great similarity can be seen in values that RCS takes and found what sides are more feasible to be detected by a radar with its respective frequency.These polar images shown allow visually determining and analyzing the most critical points of the two results obtained: Red for CADRCS and blue for POFACETS. Each previous simulation is taken to one degree of resolution; therefore, there are 360 samples per simulation and its units are given in dBm.
On the other hand, within the RCS2Polar.vi software there is a polar chart that shows exactly the same data obtained in the two simulations but in m2units (m2). This chart allows easily determining the critical angles where it is necessary to apply RCS reduction techniques.
Evaluation of RCS
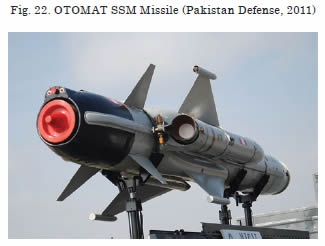
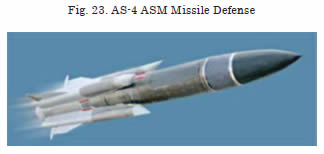
A possible event is determined to establish the need for the use of RCS reduction techniques in the design of ships. For this, a missile attack is evaluated; in this case an OTOMAT missile was selected and the AS-4 for surface-to-surface warfare and air-surfacewarfare, respectively, given their widespread use in armed forces worldwide and the ease of access to information in databases.
Missile Characteristics
• OTOMAT (SSM) – Band X 8 At 12 GHz (Knott, Shaeffer, & Tuley, 2004)
• AS-4 (ASM) 14 – 15GHZ (Forecast International, 2011)
To determine the radar frequency at which to perform the tests, various bands and applications of these in military operations are consulted resulting in the study of Band I / J (X Band Radar & Ku). This is a relatively popular radar band for military applications such as airborne radars for the exercise of functions of intercepting, hunting, and attack of enemy combatants and targets on land and sea. The size of the very small antenna provides good performance and, hence, its frequent use in missiles (Wolff, 2011).
Some aircraft like the Sukhoi have Kh-59MK anti-ship missiles with increased range. Its active ARGS-59 radar seeker has a maximum detection range of 25 km against 5000 m2 RCS targets and 15km against 300 m2 RCS targets.The cruising altitude of the Kh-59M is about 7 m above water or 50-1000 m above the ground. It can be launched at speeds of 600 to 1000 km /h at altitudes of 0.2 to 11 km [15].
The following tests were carried out in the POFACETS software, given that the results with this software are very similar to those obtained with CADRCS, and offers freedom of license, easy modification of type of material in its database and allows easily performing simulations and changes and quickly.
Results
Tests are developed with the following configuration:
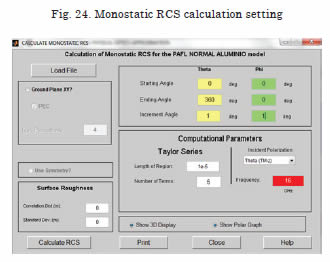
The increased resolution of one degree is configured, the start angle: 0, final angle: 360 to theta, frequency 16 GHz test set and 3D model and polar plot display features activated. Simulation of four designs of vessels for steel, and Eglass with Polyethylene Fiber materials.
For each model simulations with RCS values of 360°, weproceed to obtain a characteristic value of these 360°, data with which we will compare the results of the experimental design, and the 90° angle value is selected being the starboard angle, one of the sides together with port side where the highest amount of RCS is reflected.
The data are shown in the following table:
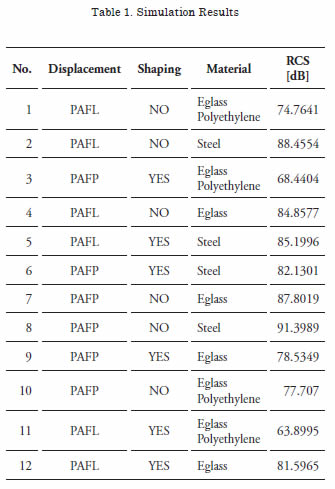
With the JMP 9.0 software, which allows for statistical analysis of the data, a series of tests are stipulated that permit full analysis of the different variables affecting the variation of RCS in a ship. For this, handling of shapes is initially set, making modifications to the PAF-P and PAF-L, to its main outer structure, turning the superstructure into faces perpendicular to the surface, followed by handling of materials; steel, fiberglass E-glass, and a composite between E-glass and polyethylene, and ending by comparing the sizes of the two vessels; displacement.
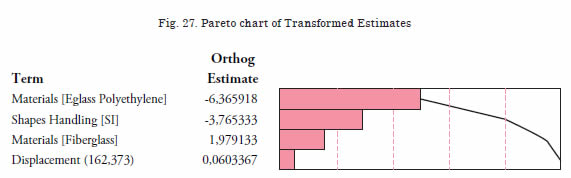
The Pareto diagram (see Fig. 27) can determine which is the most critical variable or greater impact on the RCS obtained and, in this case, if there are relationships between variables that influence the increase or decrease of the RCS. From the results, it can be seen that using composite materials like Eglass with polyethylene; fiberglass with polyethylene, allows for greater reduction in the RCS of a vessel, followed by Shapes Handling, proper shapes handling in the hull design of the vessel allows for a considerable reduction of the amount of energy reflected to enemy radars. Then, by handling these two variables the behavior of the model can be determined.
Another type of composite material,fiberglass, also called glass-reinforced plastic (Mayer, 1993) reflects the importance of using such materials in the manufacture of the superstructure, given that it absorbs large amounts of radar power in comparison to naval steel, it has great strength, light weight, and supports drastic weather variations.
Finally, it is remarkable that RCS behavior does not vary significantly with respect to the difference in displacement between the PAF-L and the PAF-P.
Conclusions
Given the results of this research, we can see that using POFACETS software as a tool to predict radar cross section is suitable for the development and scope of the objectives of this research. However, it should be noted that large global computational tools are available, which are used in the shipbuilding industry that allow more accurately predicting RCS in warships, considering factors like reflection of radar waves in the sea, conditions of the sea state, and more features such as ability to detect "hot spots" and ray tracing to identify parts of the structure that generate them.
Most computational tools for predicting RCS use prediction methods associated with physical optics because it is a high-frequency approximation that provides the best results, it does not consume excessive computational resources, and simulation time is relatively short compared to other methods like moments and the finite difference, which are used in software presented in this research. Nonetheless, the big disadvantage that leads to using other methods different other than physical optics to predict RCS, is that this method only works for high frequencies of detection.
Variables were identified that especially influence in the radar cross section of the type of shape of the superstructure and the hull, the type of material used in the construction of the vessel and its likely displacement, which in the experiments performed revealed that the type of material used has the most influence on the RCS followed by the handling of shapes, and – finally – displacement. In particular, evidence of the importance of using composite materials with lining in the manufacture of the superstructure of a vessel, such as fiberglass with polyethylene, because they absorb great amount of radar energy in comparison to other materials as the sole use of fiberglass and steel, have high resistance, light weight, and support drastic climate variations ideal for everyday naval operations.
The result of this research focused on using the knowledge acquired during its development in future designs of surface platforms with low radar cross section, which can be done by applying RCS reduction techniques, focusing on the use radar absorbing materials (RAM) in those parts of the ship that require such and the proper handling of shapes in designing the hull and superstructure, which allows significant reductions in the amount of energy reflected to enemy radars.
Bibliography
AIRPLANE DESIGN. (2011). AirPlane Design PJ Gates - Ship Detection and Counter Detection. Obtained from http://www.airplanedesign. info/
CADRCS, C. (2012). PC, MAC, and GNU/ LINUX BASED SOFTWARE FOR RADAR CROSS SECTION SIMULATION. Accessed in October 2011.
CAMTECH Camouflage Technology. (2005). SPECTRO DYNAMIC SYSTEMS. Accessed inOctober 2011, from www.camouflage.com. au/SPECTRO/Solve%20Low%20Observe. htm
CHATZIGEORGIADIS, F. (2004). Development of Code For a Physical Optics Radar Cross Section Prediction and Analysis Application. Naval Postgraduate School.
CHEVALIER, F. L. (2002). Principles of Radar and Sonar signal processing.London: Artech House.
DÍAZ, V., DOMINGUEZ, K., & SARAVIA, J. (2012). Estado Del Arte Del Manejo De La Seccion Transversal De Radar.
DVICE. (2009). DVICE SWEDEN. Accessed inOctober 2011, from www.dvice.com/ archives/2009/02/sweden-creates.php
DVICE. (2012). DVICE. Accessed inOctober 2011, from www.dvice.com/archives/2009/02/ top-secret-navy.php
FORECAST INTERNATIONAL. (2011). The Market for Anti-Ship. Revista(http://www. forecastinternational.com/samples/F658_ CompleteSample.pdf ).
GARRIDO, E. J. (September 2000). Graphical User Interface for a Physical Optics Radar Cross Section Prediction Code. Master’s Thesis. Monterey, California: Naval Postgraduate School.
GATES, P. (2012). Ship Detection and Counter Detection. www.airplanedesign.info, www. ausairpower.net
gCaptain. (11 February 2009). Visby Class – Stealth Ship Of The Swedish Navy. Accessed inOctober 2011, from www.gcaptain.com/visby-classstealth- ship-of-the-swedish-navy?6484
JENN, D. C. (1995). Radar and Laser Cross Section Engineering. Washington D.C.: AIAA Educations Series.
JENN, P. D., GARRIDO, C. E., & CHATZIGEORGIADIS, M. F. (2004). Software: Pofacets 3.0. Monterey, California: Naval Postgrade School - Philippine Navy - Hellenic Air Force.
KNOTT, E. F., SHAEFFER, J. F., & TULEY, M. T. (2004). RCS. Technology & Engineering.
LUCERNHAMMER. (2010). Accessed inOctober 2011, from http://lucernhammer. tripointindustries.com/
MARITIME SAFETY INFORMATION. (2009). CHAPTER 1 — BASIC RADAR PRINCIPLES AND GENERAL CHARACTERISTICS. http://msi.nga.mil/ MSISiteContent/StaticFiles/NAV_PUBS/ RNM/310ch1.pdf.
MAYER, R. M. (1993). Design with reinforced plastics.
MICROWAVES 101. (2012). Microwaves101. Accessed inOctober 2011, from www. microwaves101.com
NET RESOURCES INTERNATIONAL AIRFORCE. (2012). Air-Force Technology. Accessed inOctober 2011, from www.airforcetechnology. com
NET RESOURCES INTERNATIONAL NAVAL. (2011). Naval - Technology. Accessed inOctober 2011, from http://www.navaltechnology. com/projects/lafayette/lafayette1. html
NOTICIAS 24. (2008). Missiles Fire and Forget. Noticias 24.
ORBIT-FR. (2012). Accessed inOctober 2011, from www.orbitfr.com
PAKISTAN DEFENSE. (2011). Pakistan Defense. Obtained from http://www.defence. pk/forums/bangladesh-defence/168816- bangladesh-army-52.html
REVISTA NAVAL. (2012). Revista Naval. Accessed inOctober 2011, from www.revistanaval.com/ articulos/tecnologia_stealth.htm
RIUS CASALS, J. M. (1991). Sección recta de blancos radar complejos en tiempo real. Departament de Teoria del Senyal i Comunicacions. Catalunya, España: Universitat Politècnica de Catalunya.
ROKE. (2012). EPSILON. Accessed inOctober 2011, from www.roke.co.uk/epsilon/
SAHAJANAND. (2011). Sahajanand Laser Technology Limited. Accessed inOctober 2011, from http://www.sltmicrowave.com/products. php?tab=1&#Conical_Rubber_Based_Radar_ Absorbent_Material
SIEPEL. (2011). Absorbants électromagnétiques. Accessed inOctober 2011, from http://www.siepel.com/ f r / s i epe l - f r anc e /produi t / abs o rbant s - %C3%A9lectromagn%C3%A9tiques
SKOLNIK, M. I. (2001). Introduction to Radar Systems 3rd Edition. New York: McGraw Hill.
TAYLOR, M. (2012). Soviet Missiles. Obtained from http://personal.inet.fi/cool/foxfour/ sovmis/sovmis-as.html
VIRTUAL MARINE ARSENAL. (2007). Virtual Marine Arsenal. Accessed inOctober 2011, from www.bodrum-bodrum.com/vorteks/ arsenal/stealth.htm
WOLFF, C. (2011). Radartutorial. Accessed inOctober 2011