New technological surveillance and benchmarking theories and tools applied to sustainable and strategic planning of the naval industry
Aplicación de la Inteligencia Competitiva y el Benchmarking de nuevas teorías para el desarrollo de un Plan Estratégico y Sostenible para la Industria Naval
Esther Álvarezz1
Luis Enrique Sánchez2
Santiago Molins3
Abstract
Since their beginning, companies establish procedures to observe their competitors. Methods for obtaining this kind of information have evolved with the internet era; a plethora of tools is nowadays available for this job. As a consequence, a new problem has emerged: documentary noise, keeping companies from being able to process and benefit from the huge amount of information gathered. Strategic planning mainly relies on obtaining environmental knowledge, so companies need help on dealing with this documentary noise; technological surveillance and benchmarking are preferred methodologies to achieve this objective, coping with data produced by automatic internet tools like search engines and others. Qualified results of better nature are produced by bringing new theories on information gathering and processing into both tools. This article exposes empirical results on the application of a demonstrative technological surveillance system based on different R&D management structures, relying on benchmarking indicators for the naval and aeronautics industries.
Key words: Technological surveillance, benchmarking, neural networks, internet, strategic planning, technological indicators, market intelligence, trackers, indexers, feeders, decision structures, search engines, semantic web.
Resumen
Desde su inicio, las empresas establecen procedimientos para observar a sus competidores. Los métodos para obtener este tipo de información han evolucionado con la era del internet; una gran cantidad de herramientas está disponible en la actualidad para esta tarea. En consecuencia, ha surgido un nuevo problema: ruido documental, que evita que las empresas procesen y se beneficien de la gran cantidad de información recolectada. La planeación estratégica principalmente se apoya en el conocimiento ambiental obtenido, así que las empresas necesitan ayuda para tratar con este ruido documental; la vigilancia tecnológica y el benchmarking son metodologías preferidas para lograr este objetivo, y hacer frente a los datos producidos por herramientas automáticas del internet como motores de búsqueda y otras. Este artículo expone resultados empíricos acerca de la aplicación de un sistema demostrativo de vigilancia tecnológica basado en diferentes estructuras de gestión de I&D, confiando en indicadores de benchmarking para las industrias navales y aeronáuticas.
Palabras claves: Vigilancia tecnológica, benchmarking, redes neuronales, internet, planeación estratégica, indicadores tecnológicos, inteligencia de mercado, seguidores, indizadores, alimentadores, estructuras de decisión, motores de búsqueda, web semántica.
Date Received: February 2nd, 2011 - Fecha de recepción: 2 de Febrero de 2011
Date Accepted: December 10th, 2011 - Fecha de aceptación: 10 de Diciembre de 2011
________________________
1 Fundación In-Nova Castilla La Mancha. Toledo, España. e-mail: ealvarez@in-nova.org
2 Sicaman Nuevas Tecnologías. Tomelloso, España. e-mail: lesanchez@sicaman-nt.com
3 Iscam Desarrollos. Madrid, España. e-mail: smolins@iscam.es
............................................................................................................................................................
Introduction
We live in a complex society, both on the social side and in the business arena. Every aspect of daily work builds on the actual lines that every company, from every sector of activity, follows to succeed in achieving its strategic objectives. The naval sector, with a significant share in national economies is no exception. Until now, the main research on corporate structures in sectors such as the naval industry, have focused on its manufacturing systems and control [1].
The basis and relationships that enable good practices in business management can be modeled over two classical dichotomies, the internal/external point of views and the knowledge/know-how levels on the technical plane. The first expresses the need for contrast, where the internal procedures governed by a set of rules and practices confront against what others do and develop; the second shows how a company can differentiate from competitors, on technology or expertise, with none of the two not necessarily being the best; all these actions pursue new improvements to be consistently brought into the organization. Technological Surveillance (TS) [2] and Benchmarking (BM) are two of the most widely used methodologies to help companies to review their own organizational structures and technology, and their commitment to the company mission. History shows that companies have been looking into and comparing what competitors do since their creation; non-directed, casual or other non-organized manners are usual, even the use of existing tools that, logically, are not fully adjusted to the particular needs of each company. TS and BM are complementary methodologies and a comprehensive plethora of supporting tools are available, which allow companies to evaluate their capabilities and to outline strategic actions on the mission of achieving a privileged market position; innovation projects and research and development (R&D) activities are perfect instruments for this task.
"Technological surveillance" systems in the case of Naval Engineering will be formed from four dimensions [2]: i) Technology, the responsibility lies with the director of production, ii) Commercial, with responsibility split among the sales director, marketing, and exploitation; iii) Competitive, for which the commercial director is responsible, and iv) Socio-Economic, under the responsibility of the administrator and quality Manager).
In the case of naval engineering, technological surveillance focuses on nine areas [2]: i) Material; ii) Joining technologies and processes; iii) Marine corrosion; iv) Surface treatment; v) recycling technology vi) Improved manufacturing technologies; vii) Application of information and communication technologies vii) techniques applied to repair work, re-use, and scrapping; ix) Environmental management applied to the naval industry.
Additionally, knowledge and innovation management systems that organizations deploy are of great importance to accomplish the task of building sound strategic plans. Currently, the largest database for knowledge and innovation is on the Internet, but this information is scattered; millions of data alone do not have strategic value and, therefore, require new strategies and techniques to convert data knowledge.
Several theoretical models exist that try to explain and to settle down the structure and functioning of the innovation and knowledge paths and mechanisms for any kind of organization or enterprise. In this article, we explore three of them, the linear model, the Marquis model and the Kline model. The three are commonplace in companies nowadays and other research and development organizations, and depending on the complexity of their R&D, innovation and knowledge management systems, a best-fit model can be applied. The Linear model is the simplest one; it does not take into account feedback paths and it is fully sequential; it is far from current R&D structures, and only traditionally managed centers, mainly ones with academic activity, can be modeled this way. The Marquis model is a more advanced approach to current systems, and it is powerful enough to model young companies or others with simple management systems in this area; knowledge and innovation management systems largely in use include feedback processes and some links between earlier and later stages of the innovation process. The last model considered, the Kline model, is the most complete of the three; it is built on the principle that there are three relevant areas in the technological innovation process, briefly: research, knowledge, and innovation. These areas are connected by means of innovation paths, and there is a main path, known as the central innovation chain [3].
Currently, there are clear examples of companies using Competitive Intelligence and Technological surveillance to increase their productivity and competitiveness, among them we can highlight the Naval Sector Cluster Gallego (ACLUNAGA) created via the initiative of the Department of Industry and Trade of the Xunta de Galicia to become the meeting point of all naval officers and the maritime industry of Galicia. ACLUNGA's mission is to promote a new form of company management based on cooperation, focusing on core business, and one of the main aims is to promote innovation to add more value to the product in all stages of development, promoting R&D and strengthening the technological infrastructure with a State Technological Surveillance (TS) and Competitive Intelligence (CI) [4].
This article presents the empirical results of applying a Technological Surveillance demonstration system, focused on diverse organizational structures for R&D management, which rely on indicators from Benchmarking processes between the naval and aeronautics industries. These indicators are extracted by new tools and methods for information processing.
This introduction presents the context of the work; the rest of the article is structured into four main blocks, along with final conclusions and references. The first block describes the benchmarking methodologies, their advantages and handicaps, and the innovative approach taken for their use towards an efficient method for strategic information processing. The second block describes technological surveillance methods and their application to strategic planning; problems raised by new internet tools are noted and solutions proposed. The third block describes knowledge and innovation management system models and their application to better analyze and solve the problems noted. The fourth block addresses the study case of the article, where the methodologies and models described are jointly used to analyze the naval and aeronautics industries; results are presented.
Benchmarking methodologies for strategic planning
Benchmarking methodologies focus on comparison procedures. These procedures include several players or partners to compare with, from whom you gather information and evaluate several business aspects in a unified manner so that results can be easily confronted against other participants’ results. Additionally, there are several sensitive aspects to deal with, such as the treatment of confidential data, “only for internal use” issues, or other non-shareable information. These issues are normally dealt with by means of some anonymous procedures, like data aggregation, confidential treatment of names, or even building a model against which companies compare to, not to the actual data of others.
One of the most important premises that yield the best benchmarking results is to select a group of companies that fulfill at least good similarity criteria; notwithstanding, being also quite divergent on their achievements and structures, as one of the fundamental abilities to manage all information collected through an appropriate ICT environment, allowing us to control the its entire life cycle [5]. Usually, best-of-class companies from the same sector are chosen; thus, both directions are covered, but the view obtained still lacks a holistic approach. In this article, we have tried to enhance diversity by merging two sectors that can be seen similarly, the naval and aeronautics sectors. Both share a common industrial vision and technology issues can also be considered in parallel manner.
Benchmarking effectiveness relies on a good selection of the comparison criteria, which should be comprehensive, adapted for structure description, easily evaluated and transversal to all participants. Thereby, criteria selection also drives the identification of adequate indicators; this selection is then a way to perform identification while accomplishing the best commitment for the indicators. Some methodologies have been proposed for the benchmarking studies [6], they benefit from other techniques like balanced scorecard, and from this perspective, useful benchmark measures are those that best represent the critical success factors for the sector as a whole. Continuing with the description of new theories for technological capability enhancement, applicable in the naval sector, we can divide these capabilities into acquisitive, operative, predictive, creative, and marketing, which map directly into the usual structure of any industrial company and most service enterprises. Methodologies focus on added value in a staged process that usually follows five main steps: self-awareness of the organization, identification of value added areas, needed technological capabilities, classical benchmarking (indicators, evaluation and comparison against a reference), and analysis and diagnosis. A clear example of how the Internet can help generate new knowledge and value in the naval industry can be seen in the research for this for “hemorrhage control” [7].
Some research [8] is also underway on the application of Neural Networks (NN), Fuzzy Logic (FL), Genetic Algorithms (GA), and Particle Swarm (PS) methods for business optimization. The use of NN techniques allows modeling business results as the output of a learning process based on key company variables (economic factors, level of staff training, competitiveness, research and development). Also, PS can simulate the benchmarking processes that companies use continuously to enhance their market performance and evolve over time.
Other approaches [9] focus on the evolving relationship of the two factors that drive a company’s products or services, customer needs, and competitor performance. Terms like quality, cost, functionality and even technology change over time and most product design processes do not invest enough efforts on taking care of their evolution. Forecasting techniques and benchmarking information drive the gaining of competitive advantage for companies that use dynamic models to improve their processes, integrating the results into their strategic plans.
In this article, we consider that all these approaches to the benchmarking process target specific issues that must be cared for, and we show that one of the key points is the adequate identification of evaluation criteria and correct selection of useful indicators. The naval industry carries out benchmarking studies from time to time [10, 11]; these studies cover issues on the main levels of business strategic and organizational development and also benchmark specific technical areas that build up the technological background of the sector.
We can extract a common benchmarking layout from several studies carried out during the past few years in the naval sector. This exercise leads to our focus in this article, the sensitive analysis of data collected. The US Navy’s 10-step process [12] has served as a guide for some of them; also, its proposal can be comprehensively adapted to the aeronautics sector as it gathers the best practices from other BM methods used by consultancy companies and main players in the field. Nevertheless, we cannot oversee the main differences between both sectors (setting the defense area aside), which are cargo-oriented applications in the naval sector vs. passenger transportation in the aeronautics sector; the technological maturity of each one and the environmental issues that affect each sector differently, along with the exploitation of vessels and airplanes differs on several aspects although being quite similar in the general operation structure when cargo vs. passenger issues are dealt with. We propose using the new information processing methods to delve into the analysis stages, were effectiveness is more sensitive and improvements offer best returns on results.
Nonetheless, as mentioned before, technological surveillance is the other tool for building a sustainable and consistent strategy for the naval industry. We describe the proposed approach in the following paragraphs.
Technological surveillance for strategic planning
The technological aspects that strategic planning must consider are the target for the technological surveillance methodologies. With the emergence of internet, the access to information sources has become a common place to look for innovation news and competitors’ advances; TS is the method for organizing, applying selectiveness, and converting external information into knowledge to make less risky decisions and anticipate changes. Watching available technologies or emerging ones and analyzing whether they are able to take part within the products or processes of the company is the needed task, which is not always adequately performed. What must be watched are the scientific and technological advances, products and services, manufacturing processes, new materials and their transforming chain, information technologies, etc., and an applicability assessment must also be carried out on the information gathered; this assessment is the most sensitive step. Thus, potential lines of interest are detected and can be conveniently brought into the organization’s value resources.
The current tools for TS on the internet have reached a so-called second generation. First generation tools are the classical search engines and directory and index navigators, they have some limitations like incomplete coverage (invisible internet) and poorly advanced search options, which may produce the so-called documentary noise and silences, but on the other hand, they are precise because end sources are always reached. These tools have evolved into more powerful solutions by integrating automation, programming capabilities, and customization; this evolution is driven by a trend to seek for information quality more than for information quantity.
This second generation comprises tools like multisearch engines, extracting tools, feeders, visits analysis, website dumpers, website surveillance, markers, agents, mapping tools, and access to deep internet. Deep internet comprises online not directly accessible resources like data bases, catalogs, dictionaries, statistical reports, numerical and text information, formatted documents, multimedia files, self-excluded web sites, passwordprotected web sites, as well as the results offered by less-strict matching criteria (“like”, “related” matching). The tools of this second-generation oriented semantic analysis of the information and knowledge extraction for raising business competitiveness can be highlighted:
• Swoogle [13, 14]: A system of indexing
and retrieval for the Semantic Web documents,
i.e., a Google for the Semantic Web, though not
yet brought to the end user, who seeks, and even
classifies documents and valid measures, monitors
and analyzes vocabularies semantic Web or
ontology.
• CORESE [15, 16]: Conceptual Resource
Search Engine (CORESE) is an engine that enables
processing RDFS, OWL, and RDF instructions.
The main functionality of the tool is designed to
retrieve Web resources annotated in RDF, using a
query language based Query Language for RDF,
SPARQL, and an inference rules engine.
• WebKB [17]: This tool has an online interface
that allows sentences through creating or
sharing specialized knowledge base. The
knowledge base was nitialized with the
contents of the WordNet lexical database,
without taking into account the information
about verbs, adverbs and adjectives. Includes
ontologies as part of a knowledge base, defined
as a list of categories and formal statements
that give meaning to the category. Xiaoguang
[18] can be seen in a comparison table of this
tool with others, are best used when analyzing
each.
• Kartoo [19, 20]: It is the first free search engine
that personalizes results based on user interest
centers while allowing you to manage and
monitor information available online.
• Hakia [21, 22]: It is a concept whose semantic
search engine is very different from other
search engines. In a way, it could be defined
as an anti-seo search engine, as are its search results from those positioned on search engines
and classic style, but also to give prominence
to the page content, dive-in content semantics.
It seeks to overcome the biggest problem that
search engines crawl: its spiders are blind.
Hakia tries to improve Google's approach and uses semantic technology that gives greater prominence to the results, in turn favored by the "library" that cooperates to recommend reliable sources of information.
• Factbites: It is a semantic search engine
developed by the Australian company,
Rapid Intelligence, whose philosophy is to
provide meaningful results. It also generates
meaningful sentences that summarize the
main content of each result. For all uses of
computational linguistics, data mining, data
storage, and artificial intelligence.
During this second generation, things have evolved from inputting and querying data into seeking knowledge within the data. This new generation has been named as the "Age of Knowledge", and its main features are that, i) it allows the extraction of raw data from Internet using "crawlers", and that, ii) it allows the further processing of these data using "business intelligence" techniques, which will lead to knowledge. That knowledge turns into a competitive advantage for those companies able to use it.
There is lots of information not able to be indexed by standard web spiders from classical search engines; this information is located behind documentation services, data bases, and other repositories that need a special access application. Some efforts were made a few years ago and the Z39.50 standard [23] was revised and evolved until the protocol pair Search & Retrieval via URL/Web Service (SRU/SRW) [24], which kept the original powerful queries and integrated over hypertext transport protocol (http) communications protocol; the original Z39.50 and its derivative protocol pair allow for searching and retrieving information from remote databases, they are widely spread among integrated library systems and bibliographic software. The fact that puts all this kind of information on the deep side of internet is that a client application is required on the user side, setting aside standard search engines. Multi-search engines combine results from several standard search engines so that information throughput is maximized, and also meta-search engines offer enhanced task automation and are extremely configurable so that they can solve specific search and retrieve tasks. Duplicate removal and result classification are among the most usual features that help in the task of managing the huge amount of information that today’s internet holds inside.
Web trackers are tools that explore the hypertextual nature of the web; results are obtained by exploring the hypertext tree from an initial site that acts as the seed. Links are tracked and daughter web pages are classified according to their relevance, often with some weighting criteria. Likewise, selected pages’ links are tracked and granddaughter pages are again explored, so this process continues until some limiting criteria is reached, usually the exploration time or the depth level of the links. This technique is prone to getting looped and to generating documentary noise, feedback mechanisms on these issues help as a kind of learning process.
Its evolution has brought a highly specialized set of tools that can build up “maps” on the information retrieved. Maps are graphical descriptions of web sites and their contents. Quantitative data are integrated into the maps, providing a high degree of detail. Maps offer a very intuitive view of the relative content of web sites as information is presented in a “geographically” significant manner, showing aggregate information over a two-dimensional representation of the set of sites searched.
A very useful derivative of this is the specific buildup of technology maps, TS methods also include information not only on the technology itself but also where it is being developed (i.e., by which research groups). A well-known application of this kind is the search and mapping of intellectual property; patents are well-documented and are searchable by applications like the Matheo Analyzer [25] and others.
The concepts behind these mapping tools are the object of further research, some work [26] on concept maps and their mining is based on concept extraction tools. The authors referred propose a method based on the use of grammatical parsers and latent semantic analysis, a three-stage procedure is also proposed: Concept Extraction, Relationship Extraction, and Topology Extraction. The method was tested among a selected corpus of essays, providing a good benchmarking basis for the evaluation of the proposed algorithms for concept extraction. Concept Map Mining (CMM) is one of the promising tools that will produce innovative solutions to what the main statement of this article proposes; it has served as the guiding basis for the development of this study, which relates Technological Surveillance to Benchmarking.
All these methods, tools, and applications build up the Technological Surveillance issues needed to assess knowledge on the organizational structure, production processes, research and development, and knowledge management systems that must improve the effectiveness of the inter-sector benchmarking methodology that we propose in this article.
Knowledge and innovation management modeling
Nevertheless, and despite of the known necessity of the Technological Surveillance methods and their transversal application by means of an inter-sector benchmarking, the new technologies for information processing and their increased capability for data mining have created the aforementioned problem on the business intelligence and organizational knowledge management areas, not yet satisfactorily solved: documentary noise and information noise because of the huge amounts of data and the lack of analysis, structuring, modeling, and selection procedures on the information gathered.
In the previous paragraphs, we showed several existing tools and also several techniques that form the basis of current TS tools to obtain primary information. We call primary information that which, despite being analyzed, structured, and cleaned (for example, the search results of an indexer tool), either does not fit the real needs of an entity or does not have the necessary characteristics for being naturally absorbed by the human capital of the organization.
There are multiple references [27] that focus on the models for knowledge management at an entity in a manner that is not related to human capital. They work on the information structure (and by extension on the knowledge structure) to be natural and adequate, and to be accessible and understandable within the organization. However, they do not get deep enough on the dissemination and natural assimilation by the employees, which are not able to keep at the same pace at which it is generated. At most, they consider the issuing of periodic informative bulletins.
When using TS as the basis for the strategic management of an entity, it is not profitable to keep this information stored in a structured manner, nor by communicating it through periodic bulletins. On the contrary, the information must penetrate into the daily employees’ activities, to the extent where it is useful. This way, it takes part on the value and tools that the entity provides to its employees to adequately execute their work. A perfect coordination between good management and execution of the organization strategic plan, a profitable TS policy, and a good company knowledge management system must be achieved for all efforts to be efficient and effective in all areas.
In our study case, we have worked on the impact TS has upon the organization, depending on the knowledge management system and on the enforced information distribution policy. The work is presented for TS indicators based on intersector benchmarking. The reason is that this type of watching offers a wider range on the impact measurements regarding creativity and work team new knowledge assimilation, and it also offers more evident and measurable indicators targeting an empirical study like this.
For the present study, three types of organizations were selected. They have different structures for the management and integration of R&D processes and, to a certain extent, they fit into the following theoretical models: the Linear model, Marquis model, and Kline model, which we describe hereinafter.
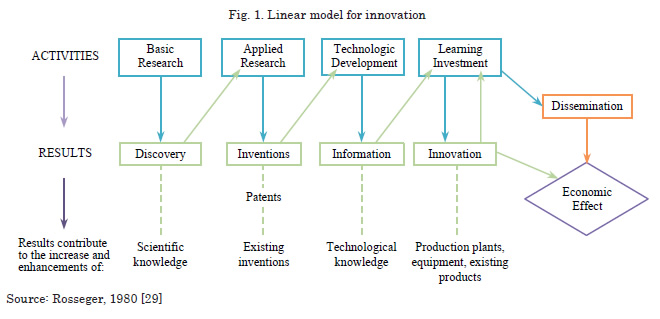
The linear model1 is based on a classical concept for R&D and innovation, where development is a consequence of research and where innovation is seemingly a consequence of development. This model, despite being the most extended as reference, is also the most distant from reality, given that it does not take into account the market influence over the first stages of the chain. This model does not relate decisions at the research stage (and at the strategic lines development) to the information gathered from the market, competitors, successful innovative results on other sectors, or new technologies. Nowadays, we can find organizations fitting into a near-linear model at the fundamental research arena, which are public or at least they are subsidized, because other organization types would not be sustainable with present business schemes.
Linear models are the so-called first generation models and, although they have evolved to models based on the “demand pull” instead of only the “technology push”, they consider only sequential scenarios, very simplified, to describe innovative processes as currently known [28]. This model will help us to identify some of the relevant indicators for our analysis, as we will describe hereafter.
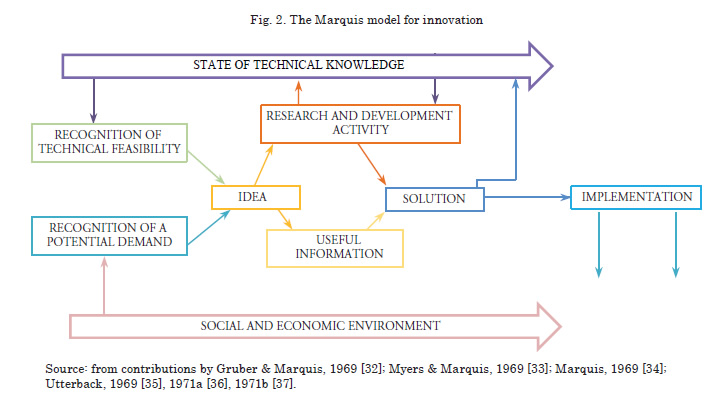
The Marquis model [30] is characterized by being the closest to business reality. It considers that innovation, and consequently research (mainly applied research) and development investment, is driven by suppliers (based on new technological offerings) and by the demand (based on social and market needs). To be precise, this model presents a new point of view in the sense that "recognition of demand is a more frequent factor in successful innovation than recognition of technical potential" [30]. Actually, the Marquis model constitutes a mixed third-generation model, where elements like technology push and demand pull are included. It also takes into account the interaction between the technological capabilities on one side and the market needs on the other, also including the feedback processes generated among the different innovation stages [28]. Second-generation models have not been considered for this study given that they do not contribute with a differential value to the analysis done because they are just staged sequential models.
The Marquis model, despite the years passed and the controversial discussions at its beginnings, is one of the best adapted to the vertiginous world of Information and Communications Technologies (ICT) and to the Information Society (IS), where it is frequent that part of the end users is ahead in needs or even leads trends. A clear example of this phenomenon is that arising from the socalled “de facto” standards born from the Internet Engineering Task Force (IETF) and from the more advanced internauts of the closing years of the 20th century. Another example of demandpulled innovations are the innovations that end users propose by themselves. Eric von Hippel [31], a professor at MIT, studied in depth the innovations produced by lead users, whom he considers a remarkable source of innovation because they anticipate market trends and also because they have the knowledge and incentives to develop solutions on their own. For this reason, companies can benefit from the systematic study of pioneer users and their activities. As can be observed, this model is an evolution from linear models that includes interactions and feedback among stages.
We must remark some characteristics of the Marquis model for a better context settling of our study, they are:
• The fundamental requirements for any idea
to progress are the technical achievability and
the potential demand, so that if no application
or end target is detected this line does not
continue. To summarize, directing lines
and, thus, the technological evolution of any
organization are led mainly by the market and
technical state-of-the-art.
• The relevant stages of technological maturity achievement of entities that adhere to this
model are:
- Conceptualization of the idea: involves
technical feasibility and market demand,
and the evaluation of the needs for research
or innovation.
- Prototype or pilot plants build-up: on
the purpose of acquiring technological
and economic knowledge applicable to the
market development of the idea.
- Design, manufacture, marketing and
introduction into market: linked to the
rendering of the R&D investment; although
scarcely considered so, it is the most
expensive stage.
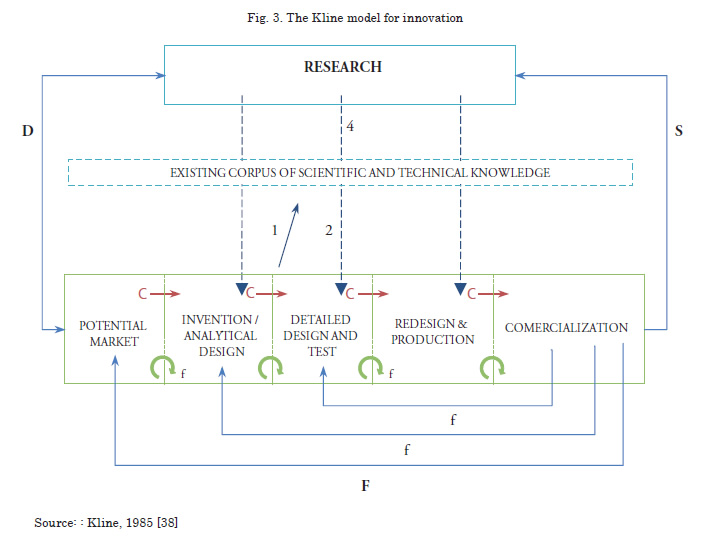
The third model (Kline) [3] presented as reference for this study is the most complete, complex, and versatile of the three. In fact, it includes the greatest set of R&D and innovation management conceptualization parameters in use nowadays. Although it is considered a third-generation model (most evolved models are fifth-generation, networked models), it sets the basis for the evolution of the fourth- and fifth-generation models as it includes indicators and flexible relationships among the different chain steps. In fact, it is called the chain model.
The Kline model considers that there are three areas of relevance in the technological innovation process: research, knowledge, and the innovation process itself. These areas can be interconnected by different paths or innovation processes. The first path, called central innovation chain [3], begins with an idea that builds-up into an invention or analytical design (engineering design) and that reacts to a market need. It is represented by C arrows.
The second path consists of a series of feedback links and other paths among steps that we describe herein:
• f and F: feedback links. Deficiency correction,
enhancements, adaptation to newly arisen
market needs, etc.
• Arrows 1-2 and 3-4. Link to research through
the use of knowledge. Research is not the usual
source for innovations.
• D: Link between research and innovation.
Research results and discoveries that come
into inventions (technology push), i.e., on
some occasions, new scientific discoveries enable radical innovations [3] page 293. Link is bidirectional, although science creates opportunities for new products, the perception of needs or possible market advantages can also stimulate important research [39] page 77
• S: Science dependency on technology.
Technological advances push deeper and more
complex research.
Although this model has been criticized, the flexibility on the interpretation for the modeling of diverse scenarios makes it a very good tool for the empirical analysis of the innovation processes. In fact, as we will see, only small conceptual modifications, or just modifying the application scope, are needed to achieve fourth-generation models (integrated models: with the addition of pipelined, concurrent or simultaneous processes, not only linear ones [40]) and fifth-generation models (where it is considered that learning takes place inside and among companies, and innovation is suggested as a network-distributed process).
Study case
To execute the present study, several entities and organizations have been studied; they present different knowledge and innovation management systems, with different evolution and deployment levels. Precisely, they have been: Public Research Centers (academic research groups and a technological center depending on a public university), private companies with different maturity levels regarding innovations and European technological centers (both public and private, and several of them organized and managed as a networked structured center).
The study was carried out at a benchmarking framework of potential areas in the transportation sector, with a special focus on the naval, railway, and aeronautics sectors; although, only naval and aeronautics results are presented herein. Specifically, and due to synergies among the technological areas, the study paid special attention to new and composite materials, communications and embedded electronic systems and new trends (i.e., photonics), sustainability and energy efficiency, habitability and hygiene, and new energy sources. Logically, none of the participating organizations fits into a particular model among those previously described. However, they are closer to a certain degree to one of them, as we can see:
• The Linear model: formed mainly by
university research groups with academic
tradition, whose main characteristic is that
their sustainability is achieved by their
teaching activities. Their scientific excellence is
far from the business reality and it is closer to
fundamental research (i.e., materials science)
or to the production of reference regulations
and standards (i.e., participants International
Telecommunications Union (ITU)’s Motion
Picture Expert Group (MPEG) working
groups).
• The Marquis model: this model is closer to
research groups that maintain approaching
policies to private companies and to the
productive sector. They usually participate
in public-private cooperation projects and in
programs issued by universities’ technology
transfer offices. This model also describes, to a great extent, companies with incipient innovation systems or without an R&D department and with lower capabilities for innovating with their own resources.
• The Kline model: Because of its versatility,
this model has been used to model companies
with high maturity knowledge and innovation
management systems, public and private
technological centers (usually with fourthgeneration
models comprising simultaneity
and process concurrency) and networked
technological centers (on the evolution path to
what is considered fifth-generation models).
To produce the study upon which the present article is based, the following components and tools were used in conjunction with variables to parameterize and model our TS & BM system:
• Tool types used for TS: Feeders based on
second-generation tools, multi-search engines
and meta-search engines, trackers and mapping
tools, gateways to infranet, specialized
data bases, libraries, specialized magazines,
dumpers and site analysis. Distribution agents
like RSS, tag clouds (at desktop or personal
space access), email, bulletins, advertisements
based on semantic analysis. Structure for
active search: parametric search engines,
indexers or semantic indexes, tag clouds,
natural navigation with temperature grading
(concept co-occurrence).
• The BM structure used is based on the Concept
Map Mining (CMM) methodology, taking as
starting point concepts like inter-sector cooccurrence
and taking the most of pre-existent
tools on some of the organizations that fitted
into the NN models and PS models.
• Information sources: news, corporate sites,
specialized websites, infranet (libraries, thesis,
reports, analytical information, usenet, etc.),
data bases and paid sites (i.e., IEEE http://
www.ieee.org, DBK http://www.dbk.es), and
technological and market observatories.
• Nature of the information: academic
information, reports, R&D papers and
articles, specialized data bases (i.e., Thomson
Innovation or Derwent World Patent Index),
corporate and institutional information,
dissemination on specialized websites, ordinary news, socio-economic environment information
• Organization type and deployed innovation
management system: cataloged according to
best-fit management model
• Professional profiles: researchers, innovation
department (in case it exists, a guiding
department, applied R&D and innovation,
etc.), product development, production,
commercial, communication and marketing,
accounting and management.
The main indicators used are:
• Adequacy and use of tools: effective viewing
and use of tools (objective criteria: used
indicator measurements, subjective criteria:
polls) and information validation (objective
criteria: increase in documentary quality/work
references, subjective criteria: polls)
• Effectiveness of the mechanisms of distribution
and sharing of information: information
intensity (few, adequate, excessive), adequacy
of information for the professional profile and
for the individual needs (understanding, use
and transformation)
• Increase of knowledge at the organization:
clients, suppliers, competitors, state-of-the-art,
products or substitute technologies, market
trends, and technological foresight (objective
criteria: comparative tests, random, single –
individual and departmental – on preselected
themes, subjective criteria: polls)
• Increase of activities that are creative,
productive, innovative, in internal and external
cooperation, analytical and of evaluation
of market/environment and competition
(objective criteria: measurement of indicators
on the respective management systems: i.e.,
ISO 9001, UNE 166000, or R&D and
innovation management system, subjective
criteria: polls)
The object of this article is not to show the TS & BM results of the organizations involved, which are private and confidential, or to show their individual characterization, but to show the impact of the ute of the aforementioned TS & BM tools in their R&D and innovation management systems. On the following global table, acceptance of the deployment of TS tools over the first months of use is presented. In many cases, these tools already existed, in other cases only periodic bulletin subscriptions or alert subscriptions in specific areas existed. With the exception of some European technological centers, all the subscriptions and data base accesses were widely wasted, but when a more advanced TS system was deployed new forms of information distribution and knowledge generation emerged within these organizations.
This map reflects, in some way, the natural acceptance of employees of TS according to the information type and to the tools used, like at feeders level, and at presentation or distribution level, or at an active search tools level. During the first month, all the tools were massively used, but during the following months, the use of some tools or others was evidenced based on the type of information, user profiles, type of organization, etc. This map, to a certain degree, presents the starting point that a TS system should provide to these organizations, for their employees to read, process, and assume information in a natural manner.
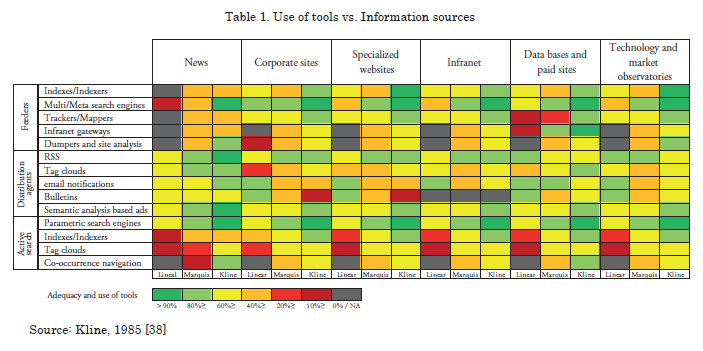
It should be noted that during the first months of the test, the evolution of the involved organizations, regarding their affinity to a particular model, was clear and evident. Thus, the areas of knowledge related to telecommunications and electronics fitted the Kline model best, and the knowledge areas related to new materials and production processes best fitted the Marquis models. This fact evolved when BM tools were introduced, the differences in knowledge areas were reduced compared to the first situation.
Another important issue to notice is that the use of certain tools depended greatly on the employees’ expertise and not only on the organizational structure or on the organizations’ knowledge management policy. The evolution of the maps on the use of tools was evident as the months passed and users discovered their usefulness; in fact, in the end the checkered pattern converged into horizontal lines depending on the type of organization.
It is good to notice that, in the organizations with a higher degree of evolution on innovation management, the most accepted and used tools (with both objective and subjective measurements) are those with a greater level of information processing and that show information naturally. The usual media, such as RSS, bulletins, and e-mail notifications were relegated to merely a periodic follow-up, with less acceptance of our target audience (clicks on information entries).
After including BM tools, the effect on the indicators was evident and revealing, even more as the system accumulated more months of use. For the BM inclusion into this study, CMM was used, making relational maps after the concept cooccurrence on the information inputs to the TS system for the selected sectors. Thereby, the input information was already processed information and it came from tools and sources that had been tested during the first months. So the concept analysis was made on the information already processed and, as had been empirically contrasted, this information had a high penetration degree into the organization, both because of its distribution and use and because of its conversion into intrinsic knowledge of the human team. After obtaining the concepts, a “depuration” was conducted by means of summarizing processes (duplicate removal, semantic analysis of the co-occurrence frame, etc.). Afterwards, CMM was applied so that concepts and sources were linked according to their relationship level (jumps between concepts and relationship cooccurrence to a greater or lower degree).
Subsequently, those concepts (or information inputs) that had just one jump of distance to the concept that was searched, indexed or referred by the TS tool were considered valid sources. Likewise, employees were allowed to navigate the relationship branches of the map, so they could make queries in a guided manner due to the relative weights of the possibly related concepts (distance between concepts and co-occurrence of related branches). The results of applying this CMM methodology, based on NN semantic and co-occurrence analysis, were not evident during the first months; however, the evolution from the third month on was exponential, and the following issues were observed:
• The gradients of the tables of “adequacy
and use of tools” presented before became
more pronounced, and the knowledge
management system reported what it needed
(tools, information sources, and information
nature) for information to be converted into
knowledge within the organization, and later
into organizational intelligence in a natural
way regarding TS.
• Indicators on creativity and generation of
successful ideas grew from 33% to 67%.
• The timing and quality of the economic and
technical feasibility analyses at the R&D and innovation, and production departments improved considerably (source: polls).
• A transition occurred from the use of passive
tools of the TS system (bulletins, e-mail alerts,
RSS news) to the use of active search tools,
even to active parameterization, according to
activities or active projects at that moment
within the organization. As an example:
creation of specific feeders for RSS agents
supported on the processed information
gathered from active search tools.
• The innovation management models of the
organizations tended to change and evolve
powered by a phenomena: the communication
and inter-relationship among the different
chain links and increased knowledge in areas
that were not previously known, depending
on the department or business unit involved.
For example, the dissemination of market
information, adequately processed, caused
deep impact on the generation of new applied
research ideas on R&D departments and
groups. The biggest change was observed in the
organizations modeled after the Linear model,
this was due to the influence of (adequately
filtered out and processed) information on
clients, competitors, substitutive technologies,
market foresights, etc., that broke the linear
structure of the R&D and innovation
management process. In some instances, the
organization evolved to more complex models
of innovation management, closer to the
business reality and to sustainability issues.
Finally, one of the most interesting results of the study is shown in Table 2, where the results of analyzing the tools used most by each of the profiles analyzed are presented. The adequate information (nature and type) that fitted best on each tool type was obtained from the maps of “adequacy and use of tools”, and later, the preference in the use of tools by each professional profile showed the path to choose so that the information was not only adequately analyzed and processed, but also assumed and transformed into knowledge until becoming corporate intelligence.
As with the previous tables, this last one evolved throughout the months, increasing the distribution gradient and naturally identifying the tools that impacted more on each profile and so on the different departments. This fact helped in the build-up of an efficient TS system, which could be deployed based on tools that naturally fit into the knowledge acquisition processes of the employees, therefore, limiting the use of non-optimal tools. Obviously, this fact also limited the information quantity and the documentary noise, which was produced at the turn-on milestone of the TS solution.
The use of BM tools, however, had a lesser impact on the accentuation of the preferred use of certain tools, but it had more impact on the diversification of use of certain tools. We should mentioned the use of dissemination tools or passive search on “semantic analysis-based advertisements”, which had an important impact on all professional profiles; this constituted a novelty against the already known search engines, which were accepted since the beginning.
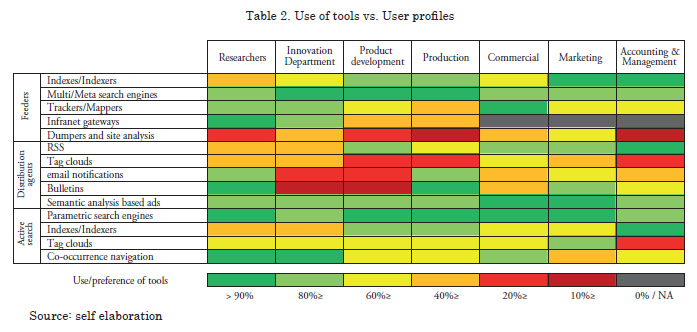
Other examples of the diversification of tools are the navigation by co-occurrence on research profiles, innovation department profiles, and commercial profiles. This type of active search had great acceptance for “documentary research” at different areas of organizations. A similar issue happened to tag clouds, which far from becoming a preferred tool, became supporting and backing tools, through which a significant number of clicks were done for the active search of information. Finally, another significant fact that arose was the use of mapping tools and tracking tools for the relational search of technology, clients, providers, etc., that were in fact unexpected and revealing on the R&D, innovation and commercial profiles.
Conclusions
The naval industry is not an exception when TS and BM methodologies come to help in improving R&D and innovation management systems. Both general methodologies are well-known, but the internet has currently raised a new problem: documentary noise produced by new tools for data gathering. Lots of information must be comprehensively processed to be useful for R&D organizations. We have presented the results of the application of new theories to succeed in extracting the best of internet information offerings. Neural Networks and Particle Swarm methods can enhance modeling tools as they are well suited for simulating learning processes and continuous management on R&D and innovation management systems. Strategic planning benefits from sound BM practices, the naval industry has been a perfect sector where BM methods have been employed and even standardized by governments to increase inter-industry cooperation on R&D and innovation management systems aiming to improve sector competitiveness. Also, TS tools have accomplished great development that provides quantity and quality information; several methods on reducing data complexity have been used by organizations involved in this case study, mainly CMM. A natural approach to the bestfitting process of these tools into organizations has been employed to finally produce an optimal R&D and innovation management system for an organization. This is accomplished by modeling R&D management systems according to three classical approaches, the Linear, Marquis, and Kline models for innovation systems. The study reviewed the deployment of TS and BM techniques on several naval and aeronautics R&D organizations (or departments of organizations), it classified them according to the innovation models, and studied the system interactions and evolution according to the rules imposed by the tools.
The results show that TS & BM tools can be very profitable for companies that are still at less-evolved stages on their innovation systems; the tools not only provided them with valuable information, but they also had impact on the evolution of their innovation processes and systems, with improvements on all creativity and innovation production indicators. Their innovation systems evolved into more complex ones, needing more complete models to describe their internal links and effects.
Acknowledgments
This research is part of the following projects: WEB4.0 (TSI-020100-2010-792) granted by the “Ministerio de Industria, Turismo y Comercio” and “Plan Avanza”.
References
1. CHEN, D., G. DOUMEINGTS, AND F. VERNADAT, Architectures for enterprise integration and interoperability: Past, present and future. Computers in Industry, 2008. 59(7): p. 647-659.
2. DUARTE, F., Vigilância Tecnológica, in Associação das industrias navais, C.d.e.e.p.e.d.d.I.D.i.n.s. naval, Editor. 2010.
3. KLINE, S. AND N. ROSENBERG, "An overview of innovation", in "The Positive Sum Strategy". 1986, National Academy Press: Washington.
4. TENA MILLÁN, J. AND A. COMAI, Inteligencia Competitiva en Empresas Industriales y de Servicio. Experiencia de Implantación en España y Latinoamerica., ed. E.E.y.P.-R.H.d.l.I. Competitiva. 2006.
5. LEE, S.-S., et al., Development of internet-based ship technical information management system. Ocean Engineering, 2006. 33(13): p. 1814- 1828.
6. KAPLAN, R.S. AND D.P. NORTON, "Having trouble with your strategy? Then map it". Harvard Business Review, 2000(September- October).
7. SNOW, C., C. OLSON, AND T. MELCER, Navy Medical Technology Watch: Hemostatic Dressing Products for the Battlefield, N.H.R. Center, Editor. 2009: San Diego, California 92186-5122.
8. BEN ABDELAZIZ, F. AND H. EL-BAZ. "An optimization model based on Neural Network and Particle Swarm: an application case from de UAE". in International Conference on Engineering Systems Management and its Applications (ICESMA). 2010. Sharjah: IEEE.
9. RAHARJO, H., et al., "Dynamic Benchmarking Methodology for Quality Function Deployment". in International Conference on Inustrial Engeneering and Enginneering Management (IEEM). 2008. Singapore: IEEE.
10. First Marine International, L., First Marine International Findings for the Global Shipbuilding Industrial Base benchmarking Study. 2005: London.
11. BROOK, D.A., et al., Benchmarking Best Practices in Transformation for Sea Enterprise. 2006, Center for Defense Management Reform.
12. KRAFT, J., "The Department of the Navy Benchmarking Handbook: A Systems View". 1997, Department of the Navy.
13. SOREN, A., et al., Triplify: light-weight linked data publication from relational databases, in Proceedings of the 18th international conference on World wide web. 2009, ACM: Madrid, Spain.
14. TIM FININ, et al., Swoogle: Searching for knowledge on the Semantic Web. American Association for Artificial Intelligence (www. aaai.org), 2005.
15. GAYO, D. Semantic Browsing of a Domain Specific Resources: The Corese-NeLI Framework. 2008.
16. CORBY, O., et al., Ontology-based Approximate Query Processing for Searching the Semantic Web with Corese. Rapport de recherche n° 5621, 2005. July, 2005.
17. OLIVIER, C., Searching the Semantic Web: Approximate Query Processing Based on Ontologies, D.-K. Rose, F.-Z. Catherine, and G. Fabien, Editors. 2006. p. 20-27.
18. XIAOGUANG, Q. AND D.D. BRIAN, Web page classification: Features and algorithms. ACM Comput. Surv., 2009. 41(2): p. 1-31.
19. MARCO, A. AND L. BIAGIO, A web search methodology for different user typologies, in Proceedings of the International Conference on Computer Systems and Technologies and Workshop for PhD Students in Computing. 2009, ACM: Ruse, Bulgaria.
20. WEINBERGER, H., J. FILIPE, AND J. CORDEIRO, Search in Context Enterprise Information Systems, W. Aalst, et al., Editors. 2011, Springer Berlin Heidelberg. p. 587-599.
21. BUSSLER, C., Is Semantic Web Technology Taking the Wrong Turn? Internet Computing, IEEE, 2008. 12(1): p. 75-79.
22. VANESSA, L., et al., Cross ontology query answering on the semantic web: an initial evaluation, in Proceedings of the fifth international conference on Knowledge capture. 2009, ACM: Redondo Beach, California, USA.
23. ANSI/NISO, Information Retrieval (Z39.50): Application Service Definition and Protocol Specification. 2003, International Standard Maintenance Agency.
24. SRU/SRW, SRU/SRW (Search and Retrieve URL/Web Service).
25. Matheo Analyzer: Database Analysis, Information Mapping.
26. VILLALON, J. AND R.A. CALVO. "Concept Extraction from student essays, towards Concept Map Mining". in IEEE International Conference on Advanced Learning Technologies 2009: IEEE Computer Society Washington, DC, USA.
27. ESCORSA CASTELLS, P. AND J. VALLS PASOLA, "Tecnología e Innovación en la Empresa". 2005, Barcelona: Alfaomega - Edicions UPC.
28. ROTHWELL, R., "Towards the fifthgeneration innovation process". International Marketing Review, 1994. 11(1).
29. ROSSEGER, G., "The Economics of Production and Innovation". 1980, Oxford: Pergamon Press.
30. MYERS, S. AND D.G. MARQUIS, "Succesful Industrial Innovations: A Study of Factors Underlying Innovation in Selected Firms". 1969, National Science Foundation: Washington.
31. VON HIPPEL, E., "The sources of Innovation". 1998: Oxford University Press.
32. GRUBER, W. AND D. MARQUIS, "Factors in the transfer of Technology". 1969, Cambridge: MIT Press.
33. MYERS, S. AND D. MARQUIS, "Successful Commercial Innovations". 1969, Washington: National Science Foundation.
34. MARQUIS, D., "The Anatomy of Successful Innovations". Innovation, 1969. 1(7).
35. UTTERBACK, J.M., "The process of innovation in instrument firm". 1969.
36. UTTERBACK, J.M., "The Process of TYechnological Innovation within the firm". 1971.
37. UTTERBACK, J.M., "The process of Innovation: A study of the Origination and Development of ideas for New Scientific Instruments". IEEE Transactions on Engineering Management", 1971. EM-18(4).
38. KLINE, S.J., "Innovation is not a linear process". Research Management, 1985.
39. FERNÁNDEZ SÁNCHEZ, E., "Innovación, Tecnología y Alianzas Estratégicas". 1996, Madrid: Editorial Civitas.
40. NONAKA, I. AND H. TAKEUCHI, "The Knowledge-Creating Company: How Japanese Companies Create the Dynamics of Innovation". 1995: Oxford University Press.
____________________________________________________________
1 The precise source of the linear model remains nebulous, having never been documented. Several authors who have used, improved, or criticized the model during the last fifty years have rarely acknowledged or cited any original source. The model was usually taken for granted. According to others, however, it comes directly from V. Bush’s “Science: The Endless Frontier” (1945) {Godin, 2005 #26}