Using anthropometrics in designing for enhanced crew performance
Utilización de antropometría en el diseño para mejorar el desempeño de la tripulación
J.M. Ross1
Abstract
Today’s naval ship or craft designer routinely uses the principles of human factors (ergonomics) as a way to help enhance crew performance. But even though many aspects of human factors are well known, certain important categories often remain underutilized. One of these categories is anthropometrics, the study of human body dimensions and capabilities. Anthropometrics analyzes age, gender, and other data within populations of people, such as the general population of a nation or the special population of that nation’s active duty naval personnel. For the naval designer, anthropometrics helps to ensure adequate ergonomic design for the population from which the crew is drawn. The naval designer can address in a quantifiable manner issues such as lines of sight, console height and valve handle accessibility. When anthropometric principles are thus applied, the ship better fits the capabilities and limitations of the crew, resulting in enhanced crew performance.
Key words: Human factors, ergonomy, anthropometrics, ship design, performance.
Resumen
El diseñador actual de buques navales o embarcaciones rutinariamente utiliza los principios de los factores humanos (ergonomía) como una manera para mejorar el desempeño de la tripulación. Pero, aunque muchos aspectos de los factores humanos son bien conocidos, ciertas categorías importantes a menudo permanecen subutilizadas. Una de estas categorías es la antropometría, el estudio de las dimensiones y capacidades del cuerpo humano. La antropometría analiza la edad, sexo y otros datos dentro de poblaciones de personas, como la población general de una nación o la población especial del personal naval en servicio activo de esa nación. Para el diseñador naval, la antropometría ayuda a asegurar el diseño ergonómico adecuado para la población de donde se obtiene la tripulación. El diseñador naval puede abordar confiablemente asuntos como linea de visión, altura de consola y accesibilidad de agarraderas de válvulas. Cuando los principios de la antropometría se aplican de esta manera, el buque encaja mejor con las capacidades y limitaciones de la tripulación, con el resultado del desempeño mejorado de la tripulación.
Palabras claves: Factores humanos, ergonomía, antropometría, diseño de buques, rendimiento.
Date Received: February 2nd, 2011 - Fecha de recepción: 2 de Febrero de 2011
Date Accepted: February 22th, 2011 - Fecha de aceptación: 22 de Febrero de 2011
________________________
1High Ground Initiatives LLC Telephone: 443-534-5671; E-mail: jonathan@highgroundinitiatives.com; www.highgroundinitiatives.com
............................................................................................................................................................
Introduction
Often overlooked within the categories and subcategories of human factors (or ergonomics) is the topic of anthropometrics. Anthropometrics or anthropometry is derived from the Greek words anthropos (man) and metron (measure), and it is “the study and measurement of human body dimensions” (Wickens, 2003). Anthropometrics may also be defined as the science of dealing with measurement of the human body to determine differences in individuals, groups, etc. (Panero, 1979). Included are measurements of body weight and strength, as well as dimensions of various distances with regard to the body and the floor on which individuals are standing, or the seat on which they are sitting.
Anthropometrics is considered by many to be a vague subcategory of ergonomics, and receives only a fraction of the attention paid to topics such as motion sickness, fatigue, and airborne noise. However, the naval designer can benefit from knowing more about this specialized area; ship designing with anthropometrics in mind can substantially improve crew performance, not to mention safety and comfort.
This paper describes the importance of anthropometrics in designing for enhanced crew performance; discusses types, content, and examples of anthropometric data available to the designer; summarizes techniques for data selection and analysis; and presents a process and suggestions for using anthropometry in ship design.
The importance of Anthropometrics
Anthropometrics is a key ingredient in design, from furniture to underground mines to naval vessels (Lossa, 2010; Hughes, 2006; Schute, 2003). In particular, a working knowledge of anthropometry is essential to the successful design of a marine vehicle. This is especially true with regard to the placement of instrumentation and controls, accessibility for maintenance, visibility through bridge windows and clearance for safe and efficient movement about the vehicle. Poor anthropometric design can result in people bumping into overhead structures, not being able to easily reach controls, and not having visual contact with critical instrumentation. Examples of inappropriate anthropometric design include the following:
• Inability of Korean crew personnel to reach
valve handles in the engine room of a Swedishdesign
container ship.
• Inability of US Navy personnel to access equipment for maintenance in a newly built
auxiliary ship.
• Insufficient clearance between truck accelerator and brake pedals in utility trucks, resulting in unintended acceleration for drivers wearing
large boot or shoe sizes (Freier, 2010).
• Computer keyboards that are too large and require too much key force for most users
(Hwang, 2010).
• Undersized seat widths and personnel weight capacities of survival craft on oil rigs in the
Gulf of Mexico (too small for present-day
offshore workers) (BMT 2007, MMS 2001).
• Difficulty of Korean soldiers in operating US Army standard weapons, in particular the
M-1 rifle (e.g., grasping the stock, reaching the
trigger and sighting) (Hart, 1967).
There is an important distinction between anthropometrics and body mechanics. Anthropometrics makes distinctions among body variables of different populations, while body mechanics addresses practices common to any human. Examples of good body mechanics include the following (Greenwich, ABS 2003):
• Maintain a balanced, comfortable and aligned
position.
• Sit in firm, straight chairs with arm rests; avoid low chairs.
• Arrange displays for easy reading.
• Place controls and actuators (e.g., valve handles) within easy reach (preferably above hip level
and below shoulder level) and manipulation.
• Avoid twisting the back.
• Pushing is safer than pulling.
• Lift with the legs, not the back.
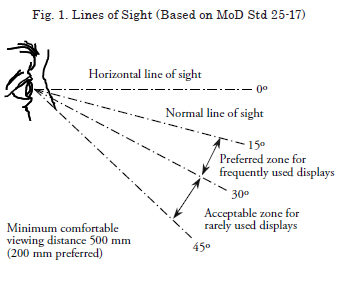
• Ensure proper eye height for comfortable viewing (Figure 1).
The same idea exists for ergonomics: common principles exist across the spectrum of humans, but dimensional details often vary from population to population, and indeed, from person to person within a given population. For example, the minimum comfortable distance and preferred angular lines of sight for viewing a console are constant for all humans (Fig. 1), but the height of the viewer’s eye when standing or seated will vary among and within populations depending on body variables
The point to remember is that any mechanical design may result in excellent body mechanics or ergonomics for one population, but may fail for another population, sometimes with serious degradation to performance, safety, and comfort.
A number of modern design guides take the distinction between ergonomics and anthropometry into account. For example, the American Bureau of Shipping (ABS) notes that its numerical guidelines apply to the population composed of North American males. ABS provides comparative anthropometric data to adapt the guidelines to other populations. ABS recommends that (1) “the height of the lower edge of the front windows of the bridge should allow a forward view over the bow, from which a person seated at the workstations can monitor, navigate and maneuver,” and (2) the height not be more than 1,000 mm (39 in) above the deck. The first recommendation applies to all human populations, but provides no specific design parameters. The second recommendation provides specific design guidance for the North American male population (ABS 2003a, 2003 b).
Anthropometric Data
General
Anthropometric data is a collection of measurements or “variables” of a sample set of individuals in a population. A sample set is collected because the population is almost always too large to measure all individuals. In a few cases, such as for Apollo astronauts, all individuals are measured. Variables and examples of data are described in the following paragraphs.
Variables
Anthropometric data has been standardized to a large extent, and variables have been developed that apply to numerous applications, from furniture to space craft. There are still differing definitions, conventions and levels of accuracy. The designer should compare data from different sources with care, as discussed in further detail in a following section. Typical traditional variables by which anthropometric data is characterized include the following (MoD Std 00-25-17):
1. Sitting height
2. Sitting eye height
3. Sitting shoulder ht.
4. Sitting elbow rest ht.
5. Thigh clearance ht.
6. Stool ht/popliteal ht.
7. Functional reach.
8. Vertical functnl reach.
9. Abdominal depth.
10. Knee height.
11. Buttock-popliteal lnth.
12. Buttock-knee lnth.
13. Inter-elbow span.
14. Standing shoulder ht.
15. Waist circumference.
16. Crotch height.
17. Hip breadth.
18. Elbow functional reach.
19. Stature.
20. Standing eye height.
21. Standing elbow height.
22. Bideltoid breadth.
23. Body breadth at elbow.
24. Foot breadth.
25. Foot length.
26. Hand breadth.
27. Hand length.
28. Wrist circumference.
29. Head breadth.
30. Head length.
31. Head ciucumference.
32. Bitragion arc.
33. Tragion to vertex.
34. Pupil to vertex.
The meaning of most of these variables is clear. Several that may not be immediately obvious are:
• Buttock popliteal length is the vertical height
of the top of the left knee above the floor in
sitting posture, with thigh parallel to the floor
and the lower leg perpendicular to the floor.
• Bideltoid breadth is the width of the shoulders at the widest point (clearance at shoulder level).
• Bitragion arc is the distance from the tragion (think “ear” for the purposes of this paper) of
one ear vertically overhead to the tragion of
the other ear.
• Triagion to vertex is the vertical distance from the top of the head to the left tragion.
• Pupil to vertex is the vertical distance from the eyes to the top of the head.
Examples of Data
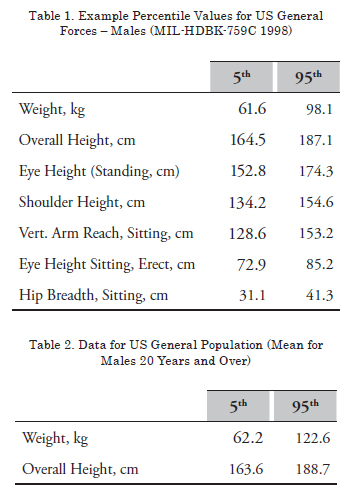
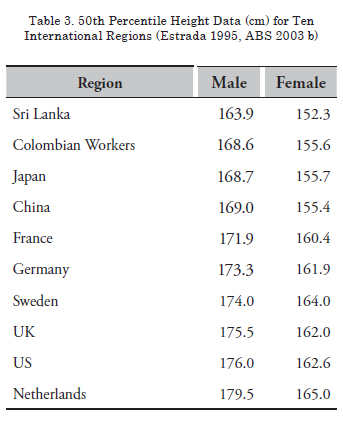
Significant amounts of anthropometric data exist, particularly for military personnel, both male and female. Example data is presented in Table 1 for males serving in US general military forces (MILHDBK- 759C 1998). Table 2 presents data for the US general population.
Table 3 presents height data for ten international regions of the world.
Following convention, this data is summarized and presented in percentiles. The data is usually (not shown here) augmented with statistical measures that indicate the validity and spread of the data, as well as the size of the population of people from which the data was gathered. “5th percentile” indicates that for a given parameter (e.g., weight), 5% of the population has a lower value, and the remaining 95% have a greater value. “95th percentile” indicates that 95% of the population is below the value and only 5% are above the value.
The following paragraphs describe representative sources of data.
CAESAR (Civilian American and European Surface Anthropometry Resource) is a survey of 40 traditional anthropometric measurements and 3-dimenisonal body scans of people in the US, Italy, and the Netherlands. A partnership of government and industry (e.g., apparel, aerospace, and automotive) developed the data base of 2,400 US and Canadian, as well as 2,000 European civilians. Data was gathered from 1998 to 2000. Subjects were male and female, aged 18-65 and representative of various weights, ethnicities, geographical regions, and socio-economic status. The data is presented in English and metric units and includes the following (SAE 2010):
• 40 traditional 1D measurements carried out
with tape measure or calliper.
• 3D scans of subjects’ body surfaces in three poses (standing, relaxed seating, and coverage),
with 100 landmarks placed on each subject.
• Extracted 1D measurements, using 3D scanning landmarks in the standing and
relaxed seating positions.
NHANES (National Health Examination Survey) is a US Centers for Disease Control and Prevention program to assess the health and nutritional status of people in the US. The program began in the 1960s and examines a nationally representative sample of about 5,000 people annually. The latest data (2007-2008) includes 10 body measurements, nine of which are applied to adults. Of most interest to naval design are recumbent length, standing height, upper arm length, upper leg length, waist circumference and weight (NHANES 2007, 2009).
ANSUR is the name of an anthropometric survey of US Army personnel conducted in the 1980s (Gordon 1988) and documented in a 1988 database. The data may also be referred to as “NATICK” because the survey was conducted by the US Army Natick Soldier Research, Development & Engineering Center (NSRDEC). ANSUR data was used as the basis for anthropometric tables presented in MIL-HDBK 759.
ANSUR II involves the conduct of a new survey and development of new models, including digital models of humans. The purpose of the work is to assist in the design of working environments, clothing, and equipment. Included in the population will be Active Duty, National Guard, and Reserve personnel components. The Army goals are to (NSRDEC 2010):
• Produce valid anthropometric criteria for
sizing and ordering equipment and materials.
• Reduce human factors risk in fast-track procurements.
• Improve operational readiness by integrating equipment and material requirements among
Army components.
• Obtain 3D modeling capabilities for designing body armor.
American Bureau of Shipping “Guidance Notes for the Application of Ergonomics to Marine Systems” (ABS 2003) provides anthropometric data for the US and numerous other nations throughout the world. Much of the guidance on size and strength characteristics is based on a population of North American males.
International data is provided as well, and was derived from two sources:
• ILO 1990, which ABS notes is from data gathered in the mid-1960s. ABS states that
certain Asian populations now have increased
height, and recommends multiplying the
length measurements by 1.02.
• ADULTDATA 1998, with data on people from selected Northern Europe nations.
The Universidad de Antioquia’s “Investigación Nacional, Parámetros Antropometricos de la Población Laboral Colombiana,” (National Investigation of Anthropometric Parameters of the Colombian Worker Population – 1995) provides data on weight, height, and of 70 other variables for male and female adults grouped by five age ranges and by percentiles, with a statistical analysis of the data for each variable. “Worker” in this context included farm, factory, service, and office workers (Estrada 1995).
“Human Factors for Designers of Systems: Personnel Domain - Technical Guidance and Data,” (MoD Std 0025-17) presents anthropometric data gathered between 1970 and 1995 on service personnel. The most recent data was gathered in 1990 and is considered by the Ministry of Defense (MoD) to be the most representative of present members of Royal Navy as well as Royal Army and Royal Air Force personnel. Thirty four variables are presented for male and female subjects. Range of movement and force data are included.
National Aeronautics and Space Administration (NASA) Human factors documents (NASA 1995, 2010b) provide example data for anthropometry, biomechanics (e.g., reach and grasp limits) and strength. Populations are 95th percentile US male and 5th percentile Asian Japanese female for the year 2000. This data is representative of the largest and smallest sizes of personnel who may crew or visit a space vehicle; NASA recognizes that actual crew and visitors may be outside this range.
Data selection and analysis
General
Anthropometric data is statistically analyzed to determine trends and to check that sufficient data has been gathered to validly represent the entire population. When the data is accepted as statistically appropriate, it may be used for design purposes. Using the data is straight forward for single variable design problems, such as ensuring that a valve handle can be reached by 95% of the population. However, when multiple variables are involved, such as in the design of a workstation, the design process is more complex, requiring special methods.
Mathematical Considerations
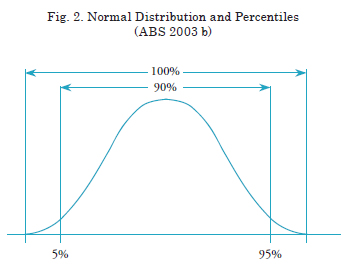
Anthropometric data is analyzed statistically to calculate distribution, standard deviation, mean, probability and similar metrics. The designer uses the results to determine whether the data is sufficient to model the entire population, or if there are gaps or outliers that show additional data is needed. The designer also uses the results to determine the maximum and minimum for the magnitudes of variables based on percentile. Fig. 2 shows a normal distribution of data, the 5th and 95th percentiles, and the quantity of the population contained within the entire data set (100%) and between the 5th and 95th percentiles (90%).
Variables (e.g., height) from two or more normal distributions can be combined to produce a single lumped distribution. However, the user must be aware of pitfalls, such as the need for iterative calculations to determine percentiles (Nadadur, 2009; Pheasant, 2006).
Selecting a data range
When using anthropometric data, the range of percentiles must be specified. For example the designer may choose to size a human-system interface to meet the dimensional needs of 90% (that is, the population between the 5th and 95th percentiles) of the military population.
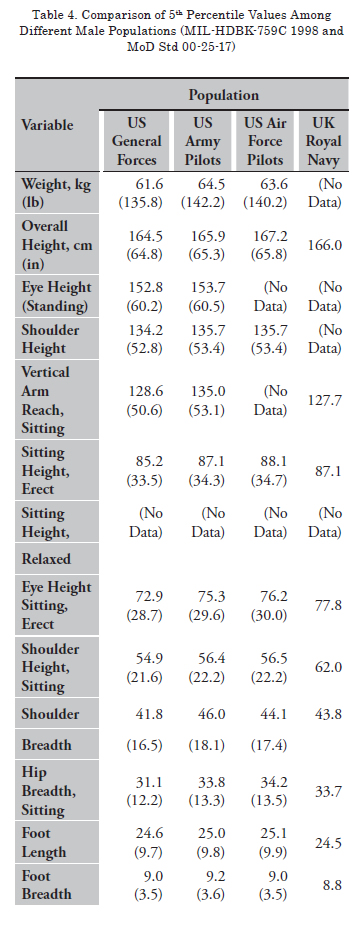
In practice, larger people may be able to squeeze into tight spots, and smaller people may be able to reach a bit further than their comfort zone, but the idea is that data within specified percentiles provides the designer with a realistic dimensional framework. For US General Forces (males only, Table 1) within a range between the 5th and 95th percentiles, the designer would use 61.6 kg as a minimum and 98.1kg as a maximum for weight. The minimum weight would be lowered at the 5th percentile end if females are included (MILHDBK- 759C 1998).
Whether to use a 5th or 95th percentile or an inclusive range depends upon the design situation. For example, when designing for maintenance access behind installed equipment, the shoulder width of the 95th (larger size) percentile should be used. This ensures that only a small 5% of the population will have possible problems with access. On the other hand, when designing the location for a valve, reach can be important, and the designer will use a 5th (smaller size) dimension. As a result, all but 5 percent of the population can easily reach the valve (Panero, 1979).
Note that this approach results in an imperfect accommodation of the remaining 5%. For critical applications (e.g., emergency breathing apparatus) and for screened populations with specified anthropometric characteristics (e.g., helicopter pilot maximum height), the designer must accommodate 100% of the population.
Table 4 compares 5th percentile male data from US general forces, Army pilots (1966), US Air Force (1967) pilot officers (MIL-HDBK-759C 1998), and the UK Royal Navy (1990)(Mod Std 00-25-17). Note that the Royal Navy data is the most recent and are the only data applicable directly to marine vehicles. Sitting dimensions are measured from the top of flat, uncushioned benches on which subjects are seated.
Factors of Variability
Populations vary significantly. For example, the smallest male population is made up of the Pigmies of Central Africa, with a mean height of 143.8 cm (56.6 in), while the tallest, in the Sudan to the north of Africa, have a mean height of 182.9 cm (72 in) (Panero, 1979). Thus, the Sudanese are 27 percent taller than the Pigmies. A naval designer would certainly want to take this sort of difference into account when addressing critical dimensions in a ship or craft design. While such a large range is not found when comparing other populations, the variability can still be important and should be considered.
Variations may be categorized in the following way (Panera, 1979; ABS, 2003b; NASA, 2010):
• National origin.
• Age.
• Socioeconomic factors.
• Gender.
• Clothing.
• Posture.
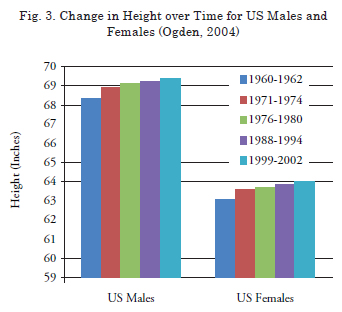
In addition to the above variations, given populations such as “the general population of the US” will change over a period of time. An example is the increase in obesity (defined as the body mass index above 30) of the US general population from 13.4 % in 1960-1962 to 34.3% in 2007-2008 (Flegal, 2010; Ogden, 2010). Another example is the change in height, as shown graphically in Fig. 3.
The Multivariant Challenge
Single and Multi-Variant Analyses
The traditional approach to analyzing and using anthropometric data is through 1D physical measurements. Indeed, a single variable is sufficient in certain contexts, such as a minimum clearance between deck and overhead, or a maximum allowable weight. However, the designer soon finds that more than one variable may be involved, such as height and width for a door opening. In these cases, the designer needs to employ a “multivariant” analysis.
At first examination, carrying out a multivariant analysis may appear straight forward. Sometimes that is the case, because certain variables are statistically correlated. For example, stature, chest circumference and waist circumference are correlated and can be combined to develop specifications for clothing. In general, a high degree of correlation exists between height variables (waist height, crotch height, and sitting height) and arm and leg lengths. Thus, combining two or more variables can be valid (MIL-HDBK-759C). But the situation soon becomes more complex, because strong correlations do not exist between all variables. For example, there is only a weak correlation between height and strength.
The Average Person
The naval designer may be tempted to choose the 50th percentile anthropometric characteristics as the basis for an “average person model.” This approach is not valid, and has been named the “average person fallacy,” because different people vary in different ways; there is no average person. Also, percentiles are not additive. As shown by Robinette (1982) the sum of 5th percentile parts making up the height variable does not equal the 5th percentile height in a population.
Dr. H.T.E. Hertzberg states that men who are average in two variables are found in only seven percent of the population; those who are average in four variables are found in three percent of the population. There are no men who are average in ten variables (as reported in Penero 1979, MILHDBK- 759C).
Consider the design challenge of a multidimensional work area, such as a cramped control station in a shipboard crane. All of the following variables may be important:
1. Sitting height.
2. Buttock-knee length.
3. Buttock-heel length.
4. Functional reach.
5. Sitting knee height.
6. Bideltoid breadth.
In this example, the designer may use anthropometric data from the UK Royal Navy and may want to design the work area to fit everyone from the 3rd to the 97th percentiles. For just one variable (e.g., “sitting height”), the goal is met: the work area can be designed to fit all individuals between the 3rd and the 97th percentiles. But if the work area must simultaneously fit the 3rd to 97th percentile individuals from both of the first two variables, then fewer individuals are included. The reason is that there is not a perfect overlap between the individuals within the 3rd to 97th percentiles for “sitting height” and those individuals within the 3rd to 97th percentiles for “buttock-knee length.” As more variables are added, the work area fits fewer individuals. Only 78% of the population will fall within all six of the above “3rd to 97th percentile” variables (MoD Std 00-25-17).
One general anthropometric design approach considers three design solutions (NASA 2010):
• Single solution for all members of a population. This may be practical in cases where the
population consists of screened individuals
who meet specified dimensions, such as with
helicopter pilot maximum height.
• Adjustment of equipment increases the range of accommodation. For example, height is a
common adjustment for seats, where the lowest
adjustment may be for the 5th percentile female
popliteal height, and the highest adjustment
for the 95th percentile male popliteal height.
• Several solutions are available and the user
chooses the one that best fits their dimensions,
such as with clothing sizes.
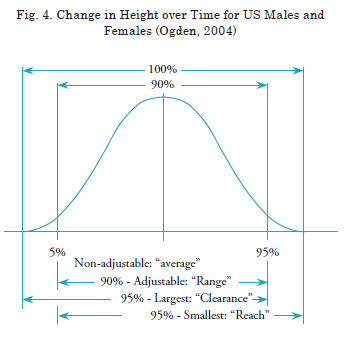
A similar approach uses the following four design principles (ABS 2003b):
• Design for the average - application is for
nonadjustable situations such as work stations
and desks
• Design for the range application is for adjustable situations, such as seating. Generally, the
design will accommodate the middle 90% of
the population.
• Design for the largest - applications are mostly for clearances (e.g., hatches and walkways).Generally, the design goal is to accommodate 95% of the population.
• Design for the smallest - applications are mainly for strength (e.g., pull, push) and reach distances. Usually the reach and strength of the 5th percentile person is used as the design criterion.
Fig. 4 relates the magnitudes of these four principles to percentiles in a normal distribution.
Digital Mannequins
Human Digital Modeling (HDM) tools simulate humans by means of 3D electronic models. These tools combine computer-aided modeling with anthropometric data, and for some years have been used effectively within industry and government. Mannequins, based on anthropometric data, are placed within CAD models and exercised to develop and refine the human-machine dimensional and strength interface. To effectively address the multivariant challenge, a family of mannequins is produced through a statistical method and exercised for a given design (e.g., 5th percentile female and 95th percentile male).
The Ford Motor Company developed a set of three male (5th, 50th, and 95th percentile) and three female (5th, 50th, and 95th percentile) electronic models based on a Ford assembly worker population synthesized from NHANES and ANSUR data. The models were exercised in conjunction with automobile manufacturing processes, ensuring, for example, that the SDAR antenna could be mounted by a 5th percentile female worker (Nadadur, 2009).
NASA is active in the development of digital mannequins, using a set of “worst case” mannequins to form dimensional limits. Another solution that NASA uses to solve the multivariant challenge is to design space suits with standard size modular pieces (arms, legs, upper torso, etc.). These suits accommodate a wide range of operators and passengers and replace the expensive tailored space suits of the Apollo era. (Thaxton, 2007).
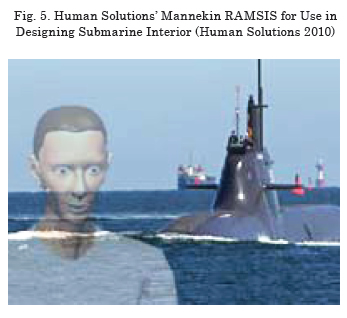
Since 1986, the German company Human Solutions has developed the RAMSIS mannequin, originally for automotive design, with emphasis on driver comfort and posture. The company has applications tailored to industrial vehicles and aircraft, and is presently entering the submarine design arena (Fig. 5). The mannequins are based on anthropometric data appropriate for each field of application (Heiner, Human Solutions 2010, van der Meulen 2007).
Digital Mannequins
As made clear in the preceding sections, the field of anthropometrics is complex. Fortunately, a number of organizations (e.g., ABS, NASA, UK Royal Navy) have applied the principles of ergonomics, including anthropometrics, by using a known population and known variables, and have developed standards for sizes and clearances for numerous conditions directly related to ship design. These standards are already met by much existing commercial marine equipment, workstations, controls, and other instances of shipboard humanmachine interfaces. In addition, most designers are familiar with these standards.
The challenge arises when the population that will operate and maintain a ship is significantly different anthropometrically from the population upon which numerical standards have been based. Often, this challenge does not arise at all. Most commonly, the challenge arises only for certain key factors, such as reach distance. Typically, mismatches are found when an existing design is exactly duplicated for a new population.
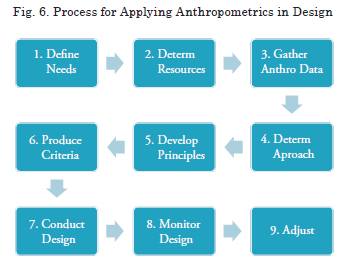
In general, the design process consists of nine steps, beginning at the start of a project and ending at the completion of Function Design. The steps are described as follows (diagrammed in Fig. 6):
1. Define the needs, that is, where
anthropometrics can effectively improve crew
performance. Needs may be driven by new
design constraints for the particular ship (e.g.,
space constraints), or adapting the design to
an existing design from another country, or
adapting to design specifications based on
another population.
2. Determine available resources, including budget, personnel, and schedule availabilities.
3. Gather anthropometric data, whether from a sample of an applicable population (e.g.,
measuring 1,000 individuals from a population
of 10,000), or derived from a more general
population (such as “all workers of a particular
nation”). Analyze the data for validity and
trends.
4. Determine the anthropometric approach, which may be single/multi-variant, coupled
with a traditional application or with
electronic mannequins. Determine how the
anthropometric approach will be integrated
with the ship design and with CAD modeling.
5. Develop design principles, which may be based on single solution/adjustment/several
solutions, or average/range/largest/smallest, or
some combination.
6. Produce the design criteria for use by the designer, through application of the design
principles to the applicable ranges of data.
Document this in a format that can be applied
and monitored effectively. As appropriate,
develop a family of electronic mannequins.
7. Conduct the design, from concept through functional.
8. Monitor the design to ensure that the criteria are being properly applied (this is quality
assurance), and to detect unforeseen problems.
9. Adjust steps 1-8, adapting to project changes (such as budget and scope) and responding to
unforeseen problems.
The following sections briefly describe particular suggestions to help maximize the fit of a marine vehicle to a particular user population. The designer applies certain anthropometric principles at increasing levels of detail as the ship design process proceeds. Only basic design phases (concept, preliminary, contract, and functional) are addressed. At their completion, virtually all human factor design, including elements of anthropometrics, will be complete. The stages that follow (transitional design and workstation/zone information preparation) are concerned not with dimensions, but rather with preparing the design for production.
Concept Design
Concept design may also be referred to as the cost and feasibility study phase; the goal is to clarify customer requirements and address the balance between ship capability and cost (Gale 2003). The product of this phase is a concept design that may include anthropometric considerations such as the following (Booher 2003, MIL-HDBK-759C 1998, Todd 2005):
• Define the scope of application of the anthropometric portion of the design to be
responsive to owner’s requirements, budget,
and schedule. The scope may be limited to
only a single system, such as bridge control
and monitoring, or may be wider and
address elements such as personnel clearances
throughout the ship.
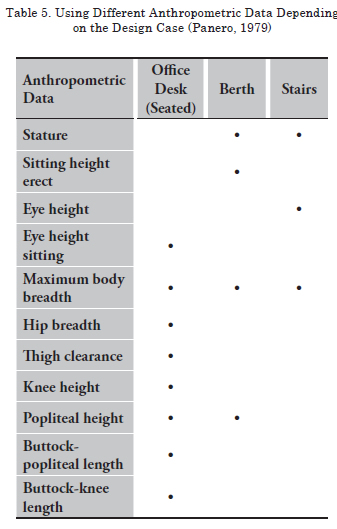
• Determine which body variables are relevant, such as reach, height, and weight. Table 5
shows typical variables required for the design
of an office desk, a berth, and stairs.
• Determine the crew population and obtain
required anthropometric data. If data is not
available, define variable limits (e.g., maximum
height) based on a more general population
from which the crew will likely be drawn (e.g.,
general population of a country’s workers).
• Use caution in applying anthropometric data. Most published data is for military personnel,
much of that is up to 40 years old, and it is – at
best – a general guide for today’s military.
• Use caution in combining two or more variables in a design. For example, a 95th percentile male
is not made up of the sum of 95th percentile
variables. Rather, a real person may be within
95th percentile in height but 80th percentile in
weight.
• Consider the variability of proportions of humans. For example knowing a height and
weight is not necessarily sufficient to accurately
predict shoulder width.
• Decide whether to design to accommodate all of a given population, such as with most naval
marine ships or only a screened population,
such as for certain environments where special,
bulky clothing must be worn (e.g., very cold
climates, special operations) (MIL-HDBK-
759C 1998).
• Consider the characteristics of the user population of operators, passengers (e.g.,
scientists), and maintainers. Operators may
be more fit than passengers; naval populations
are different than civilian populations. A
vehicle designed for a taller population may
result in controls placed too high for members
of another population to reach. Likewise,
clearances sufficient for one population may
be insufficient for another.
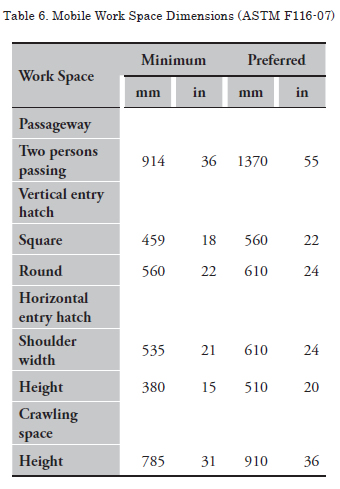
• As a baseline design guide, consider applicable
published ergonomic standards and guidelines,
such as minimum and the preferred work space
dimensions in ASTM F116-07 (Table 6) and
the ABS guides. Check the anthropometric
source of the guideline and adjust to the crew
population (e.g., ASTM F116 references US
military, commercial, and regulatory sources).
Preliminary Design
In preliminary design, top-level performance requirements are confirmed, second-tier requirements are developed, ship size and configuration are selected, systems are selected, performance is quantified, cost and technical risk are reduced, and an initial build strategy is developed (Gale, 2003). The designer may consider the following:
• Apply anthropometric principles according to
the plan developed in the concept design. This
may include ensuring maintenance clearance
is generally sufficient among various major
propulsion equipment components such as
engines and generators.
• Employ computer-aided tools, such as
maritimeEXODUS, whose models are used
to assess evacuation of personnel from a ship,
and considers human behavior characteristics,
the presence of fire, and vessel list. The model
includes vehicle geometry (e.g., decks, stairs,
and bulkheads) and characteristics of personnel
(e.g., mobility, age, gender) (Earl, 2006).
• Exercise electronic mannequins within the
ship CAD model and communicate with
other designers when anthropometric limits
are exceeded by aspects of the present design.
Contract Design
The contract design effort confirms ship capability and cost, develops information from which a shipyard can make a price bid and establishes criteria for ship owner acceptance of the ship upon completion (Gale, 2003). Anthropometric issues include the following:
• Using human subjects in a physical mock-up
can help validate anthropometric assumptions
(MILHDBK-759C 1998). Members of the
actual commissioning crew can provide
particularly valuable comments and advice.
• Electronic 3D “walk-through” modeling,
especially with electronic mannequins, enables
collaboration by designers, maintainers, users,
and owners (MILHDBK-759C 1998).
• Specialized computer-aided tools such as the following can assist the naval designer at this
stage of design:
• Crew Station Design Tool provides a means to effectively select and arrange controls
and instruments in a way that effectively
considers human engineering and
ergonomics principles (MA&D, 2006;
Walters, 2005).
• Design Support and Evaluation System is a
tool used to help design bridges for new
ships and to assess bridges for existing
ships. The tool considers numerous
factors, including physical layout, work
environment, alarms, instrumentation,
and controls (Widdel, 2000).
• Jack is a modeling tool that simulates an ergonomically accurate human in a design
environment (Siemens, 2008).
Functional Design
During function design, additional analyses are performed, such as structural and vibration analyses. Further detail is developed for structure and systems. The designer should consider the following:
• Continued use of physical mock-ups with
prospective crew members and additional
detailed computer analyses; particularly in
critical areas of the ship, such as control
stations.
• Continued use of an electronic 3D “walkthrough” modeling with electronic mannequins for collaboration by designers, maintainers, users, and owners.
Conclusions
Major conclusions are as follows:
• One size does not fit all, whether for shoes or
naval marine vehicles
• Applying anthropometric considerations to the design process is practical but can increase
costs and time; usually, anthropometrics is
needed in only certain instances
• Once determined, anthropometric data may be used for follow-on designs
• Even proven anthropometric data should be reviewed at the beginning of a design to
include changes to the population
• The payoff of anthropometrics in design is an improved fit between the operator and the
ship, and thus enhanced crew performance.
Acknowledgments
The author gratefully acknowledges the generous support and encouragement of Cotecmar and, particularly, Lt Cdr Angela Liliana Lossa Chamorro, Manager of the Accommodations Department, and Commander Oscar Darío Tascon Muñoz, Director of Research, Development and Innovation.
References
ABS (2003a). “Guidance Notes on Ergonomic Design of Navigation Bridges,” American Bureau of Shipping,” Houston, TX.
ABS (2003b). “Guidance Notes for the Application of Ergonomics to Marine Systems,” American Bureau of Shipping,” Houston, TX.
ADULTDATA (1998). “Adultdata, the Handbook of Adult Anthropometric and Strength Measurements – Data for Design Safety,” UK Department of Trade, Nottingham.
ASTM 1166-07, Standard Practice for Human Engineering Design for Marine Systems, Equipment, and Facilities, ASTM International, West Conshohocken, PA.
BMT (2007). “Human Factors Engineering Success Stories in the Oil and Gas Industry,” BMT Designers and Planners, January.
Centers for Disease Control and Prevention (2006). National Center for Health Statistics. Data from the National Health and Nutrition, Examination Survey, Figure 13, http://win. niddk.nih.gov/ statistics/ #other (accessed Nov. 2, 2009).
ESTRADA, J., J. CANCHO, M. RESTROPO, C. PARRA (1995), “Investigación Nacional, Parámetros Antropometricos de la Población Laboral Colombiana,” ACOPLA95, Universidad de Antioquia, Medellin, Colombia.
FLEGAL, K.M., M.D. CARROLL, C.L. OGDEN, L.R. CURTIN (2010). “Prevalence and Trends in Obesity Among US Adults, 1999-2008,” The Journal of the American Medical Association, Vo. 303, No. 3, January.
FREIER, S., P. SEELEY, R. MARKLIN, K. SAGINUS (2010). “Application of Electric Utility Workers’ Anthropometry to Clearance Between Vehicle Pedals and Adjacent Structures,” ‘Proceedings of the Unman Factors and Ergonomics Society 54th Annual Meeting – 2010,’ October.
GALE, P.A. (2003). “The Ship Design Process,” Chapter 5, Ship Design and Construction, T. Lamb, editor, The Society of Naval Architects and Marine Engineers, Jersey City, NJ.
GORDON, C., T. CHURCHILL, C. CLAUSER, B. BRADTMILLER, J. MCCONVILLE, I. TEBBETTS, R. WALKER (1988). “1988 Anthropometric Survey of U.S. Army Personnel: Methods and Summary Statistics,” Technical Report NATICK/TR-89/044.
Greenwich (undated). “Body Mechanics – Patient/ Family Information Sheet,” Greenwich Hospital, Greenwich CT, http://www. greenhosp.org/pe_pdf/ pt_bodymech.pdf (downloaded September 2010).
HART, G.L., G.E. ROLAND, R. MALINA (1967). “Anthropometric Survey of the Armed Forces of the Republic of Korea,” Technical Report 68-8-PR, US Army Natick Laboratories, Natick, MA.
HEINER, B., F. ENGSTLER, F. FRITZSCHE, C. MERGL, O. SABBAH, P. SCHAEFER, I. ZACHER, (2006), “The Development of RAMSIS in Past and Future as an Example for the Cooperation Between Industry and University,” ‘International Journal of Human Factors Modelling and Simulation,’ Volume 1, No. 1, December.
HUGHES, L.M., W.G. HORN (2006). “A Review and Comparison of Anthropometric Indices Applicable to the US Navy Submariner Population,” Naval Submarine Medical Research Laboratory, NSMRL/TR—2006- 1249, Groton CT, December.
Human Solutions (2010). http://www.humansolutions. com, downloaded December. Hwang, S., P. Johnson, (2010). “Computer Input Devices – Race and Gender: Is There a Mismatch Between Anthropometry and Input Device Design,” ‘Proceedings of the Unman Factors and Ergonomics Society 54th Annual Meeting – 2010,’ October.
ILO (1990). “International Data on Anthropometry,” Occupational Safety and Health Series: No. 65, International Labour Organization, Geneva.
LOSSA, A., G. ORTIZ, D. BAHAMON (2010). “Development of a Model for the Analysis and Evaluation of Ergonomic Risk on Board Vessels,” International Conference on Human Performance at Sea, HPAS 2010, Glasgow, Scotland, June.
MA&D (2006). Alion Science and Technology, Meetings, November.
McDOWELL, M.A., C.D. FRYAR, C.LL. OGDEN, K.M. FLEGAL (2008). “Anthropometric Reference Data for Children and Adults: United States, 2003-2006, ‘National Health Statistics Reports,’ Number 10, October.
MIL-HDBK-759C (1998). Human Engineering Design Guidelines, U.S. Department of Defense, March.
MMS (2001). “Water Survival Craft,” ‘MMS Safety Alert,’ No. 192 Revised, US Department of the Interior Minerals Management Service Gulf of Mexico OCS Region, January.
MoD Std 00-25-17 (2004). “Human Factors for Designers of Systems: Personnel Domain -Technical Guidance and Data,” Defence Standard 00-25 Part 17, Issue 1, UK Ministry of Defence, July.
NADADUR, G., J. CHIANG, M.B. PARKINSON, A. STEPHENS (2009). “Anthropometry for a North American Manufacturing Population,” SAE International.
NASA (1995). “Man-Systems Integration Standards,” NASA-STD-3000, Revision B, National Aeronautics and Space Administration, Washington, DC, July.
NASA (2010). “Human Integration Design Handbook (HIDH),” NASA/SP-2010- 3407, National Aeronautics and Space Administration, Washington, DC.
NHANES (2007), “National Health and Nutrition Examination Survey, 2007-2008 – Overview,” National Health and Nutrition Examination Survey, CS106114 (01/2007), T2650
NHANES (2009). “2007-2008 Data Documentation, Codebook, and Frequencies – Body Measurements,” National Health and Nutrition Examination Survey, http://www. cdc.gov/nchs/ nhanes/nhanes2007-2008/ BMX_E.htm, September, downloaded October 2010.
NSRDEC (2010). “U.S. Army Anthropometric Models to Optimize the Human Systems Interface (ANSUR II),” US Army Natick Soldier Research, Development & Engineering Center (NSDREC), Natick, MA, http:// nsrdec.natick.army.mil/ media/print/Army_ ANSURII_Trifold2.pdf
OGDEN, C., C. FRYAR, M. CARROLL, K. FLEGAL (2004). “Mean Body Weight, Height, and Body Mass Index, United States – 1960-2002,” ‘Advance Data,’ No. 347, US Department of Health and Human Services, Centers for Disease Control and Prevention, National Center for Health Services, October.
OGDEN, C., M. CARROLL (2010). “Prevalence of Overweight, Obesity, and Extreme Obesity Among Adults: United States, Trends 1976- 1980 Through 2007-2008,” Centers for Disease Control and Prevention, http://www.cdc. gov/nchs/data/hestat/ obesity_adult_07_08/ obesity_adult_07_08.htm, June.
PANERO, J., M. ZELNIK (1979). Human Dimension & Interior Space, Whitney Library of Design, Watson-Guptill Publications, New York.
PHEASANT, S., C. HASLEGRAVE (2006). Bodyspace: Anthropometry, Ergonomics and the Design of Work (Third ed.). CRC Press.
ROBINETTE, K.M. AND MCCONVILLE, J.T. (1982). “An Alternative to Percentile Models,” SAE Technical Paper 810217,y 1981 SAE Transactions, pp. 938-946, Society of Automotive Engineers, Warrendale PA.
ROSS, J. (2009). Human Factors for Naval Marine Vehicle Design and Operation, Ashgate, Farnham, Surrey, England.
SAE (2010). “CAESAR – The Most Comprehensive Source for Body Measurement Data,” SAE International, http://store.sae.org/caesar/.
SCHUTTE, P.C, M.N. SHABA (2003). “Ergonomics of Mining Machinery and Transport in the South African Mining Industry,” Safety in Mines Research Advisory Committee Final Report, CSIR Mining Technology, Project Number SIM 02 05 04 (EC 2003-0252).
THAXTON, S., S. RAJULU (2007), “Anthropometric Accommodation in Space Suit Design,” 10th Annual Applied Ergonomics Conference, Dallas, TX, March.
VAN DER MEULEN, P., A. SEIDL (2007). “Ramsis: The Leading CAD Tool for Ergonomics Analysis of Vehicles,” Proceedings of the 1st International Conference of Digital Human Modeling.
WALTERS, B., J., BZOSTEK, J. LI (2005). “Integrating Human Performance and Anthropometric Modeling in the Crew Station Design Tool,” SAE Digital Human Modeling for Design and Engineering Symposium, Iowa City, Iowa, USA, June.
WICKENS, C.D., J.D. LEE, Y. LIU (2003). An Introduction to Human Factors Engineering, Second Edition, Prentice Hall.
WIDDEL, H., F. MOTZ (2000). “Ergonomic Requirements for the Design of Ship Bridges,” Human Factors in Ship Design and Operation, London, September.