Ship Science & Technology - Vol. 14 - n.° 27 - (39-53) July 2020 - Cartagena (Colombia)
DOI: https://doi.org/10.25043/19098642.204
Lorenzo Cardona 1
William Cuadrado2
1 Facultad de Ingeniería Electrónica, Universidad Tecnológica de Bolívar. Cartagena, Colombia. Email: lorenzo9196@hotmail.com
2 Facultad de Ingeniería Naval, Escuela Naval de Cadetes “Almirante Padilla”. Cartagena, Colombia. Email: cuadradowi61@gmail.com
Date Received: April 14th 2020 - Fecha de recepción: Abril 14 de 2020
Date Accepted: June 25th 2020 - Fecha de aceptación: Junio 25 de 2020
This work studies the attenuation by rain that occurs in the Caribbean region, specifically, in high frequency bands, considering that modern communication systems make greater use of satellite bands. In this sense, the methodology of the recommendation ITU 838 was used to calculate the radio attenuation by rain in the city of Cartagena (Colombia), for the range of 1-100 GHz, and the data provided by the Center of Oceanographic and Hydrographic Research - CIOH were used as atmospheric information sources. As a result, the attenuation for the first quarter of the analyzed years was observed to be low (2.0x10⁻² dB/km), growing in the following months until October (1.0x10⁻¹ dB/km), when it decreases again. This information is particularly useful in the naval field, especially, in relation to the use of these frequencies for information exchange.
Key words: Rain attenuation, rain rate, satellite communications.
En este trabajo se estudia la atenuación por lluvia que se presenta en la región Caribe, específicamente, en bandas de alta frecuencia, considerando que los sistemas de comunicación modernos hacen mayor uso de las bandas satelitales. En este sentido, se empleó la metodología de la recomendación UIT 838 para calcular la radioatenuación por lluvia en la ciudad de Cartagena (Colombia), para el rango de 1-100 GHz, y se emplearon como fuentes de información atmosférica los datos provistos por el Centro de Investigaciones Oceanógraficas e Hidrográficas — CIOH. Como resultado, se observó que la atenuación para el primer trimestre de los años analizados es baja (2.0x10⁻² dB/km), y crece en los meses posteriores hasta llegar a octubre (1.0x10⁻¹ dB/km), cuando vuelve a presentar una disminución. Esta información resulta de gran utilidad en el ámbito naval, especialmente, en lo relacionado con el uso de estas frecuencias para el intercambio de información.
Palabras claves: Atenuación por lluvia, ratio de lluvia, comunicaciones satelitales.
When aiming to establish communication between two very distant points or when one of them is moving (ships, helicopters, airplanes, etc.), it is most convenient to use a wireless medium, such as radio signals. These signals are defined as electromagnetic waves, with an electric and a magnetic component, which when propagated through the atmosphere, present the phenomena of refraction, reflection, dispersion and diffraction [1], when the wave front goes through an obstacle. Almost all the links made are propagated in the troposphere, a layer in which meteorological phenomena such as snow, hail, fog, clouds and rain occur. Among these, rain is the main cause of attenuation for high frequency signals [2].
In recent years, there has been an increase in the use of satellite communications systems; In the specific case of Colombia, for example, in July 2018 the Colombian Air Force (FAC) was scheduled to launch a satellite in low earth orbit (LEO) with the purpose of providing security to the country by capturing images with enough resolution to detect illicit crops, forest fires, illegal mining, as well as to evaluate water resources and prevent their extinction, among other security activities for the country [3].
However, this boom in the use of communication systems poses a series of challenges, one of which is the attenuation caused by rain when working at frequencies on the order of gigahertz [4]. Rain causes signals to be attenuated because water drops absorb the energy and, sometimes, cause signal energy to be dispersed [2], resulting, in some cases, in the link not being available for a certain period. Generally, through a good design stage, there is no problem. Otherwise, two things can happen: first, the link is not available for the time required or, second, the system is over-dimensioned and achieves 100% availability at a high economic cost [5]. This attenuation phenomenon is called specific attenuation or tropospheric radio attenuation.
For this reason, in the last 13 years the Caribbean region has had a growing interest in studying how environmental conditions in the Caribbean area impact radio communications. This interest has been marked by the need to design links with guaranteed reliability. In 2007, Henríquez and Durante [6], carried out a study to obtain the radio attenuation parameter for the state of Zulia (Venezuela), calculating the tropospheric radio attenuation in dB/km for radio links and satellite systems exposed to the average rainfall of a tropical zone. The authors introduce a methodology to calculate tropospheric radio attenuation. This method consists in obtaining and conditioning the rainfall intensity values of the meteorological centers, and then applying the model provided by the ITU in recommendation P.838 [7] with which this calculation can be made. Finally, the model is applied to this monthly rainfall intensity mean (of each year) and the tropospheric radio attenuation is obtained for each month. This is the selected model to be applied in this work.
Similarly, Orozco and Durante's work [8] aimed at predicting the specific attenuation at certain elevation angles in the city of Merida (Venezuela) for the period 2011-2014. For the four years predicted, the authors found that the variation is 0.0012 dB/km for the same month and considered that it is not significant.
In Colombia, the authors Pimienta and Durante [9] conducted a study in the department of La Guajira obtaining the levels of tropospheric attenuation of radio frequency signals due to rain. In their work, the authors concluded that from 10 GHz on, the attenuation due to rain increases considerably. Thanks to these works, the parameters being analyzed to identify the signal fading conditions in the C, Ku and Ka bands in the city of Cartagena de Indias were known, contributing to the creation of a tropospheric radio attenuation map for Colombia and facilitating the future design of links working in these frequency bands.
Since the radio attenuation in the Caribbean region, mainly in Cartagena de Indias (Colombia) is the subject of this work, the methodology of the ITU recommendation 838 [7] will be applied for its calculation and how it is affected by the frequency, rain intensity and the angle of elevation of the antenna with respect to the ground will be analyzed. This study is of particular importance for use by naval fleets in their information exchange systems, including the Colombian tactical data link Link-CO, for which the communications infrastructure available in the units afloat, operates partially in the frequency bands under study.
This article is organized as follows. Section 2 presents the methodology followed to carry out the specific attenuation calculation; then, section 3 presents the results obtained from the modeling of the information available in Matlab and Excel and, finally, the results and conclusions of the work carried out are presented in section 4.
The methodology used to meet the objectives proposed in this work includes the following phases:
Phase 1. Identification of the model: In this phase the mathematical model provided by Recommendation ITU-R 838 was identified, with which the specific attenuation (dB/km) is subsequently calculated.
Phase 2. Data collection: In this phase, monthly rainfall intensity data (mm/month) obtained from the CIOH's serial publications was collected, organized, and conditioned. To use them in the calculations proposed in Recommendation ITU-R 838, they were transformed to a rainfall intensity rate per hour (mm/h).
Phase 3. Evaluation of specific attenuation: Once the monthly and annual averages of rainfall level are obtained, the specific attention YR (dB/km) is calculated considering different scenarios that allow to evaluate the interdependence between the parameters that intervene in the calculation of this factor. These parameters are: 1) operation frequency, for this case the frequencies of uplinks in the C, X, Ku and Ka bands are used; 2) polarization, considering vertical, horizontal and circular polarization; 3) elevation angle, angle with respect to the reference plane, and 4) rainfall rate, in the city of Cartagena de Indias.
Phase 4. Analysis of the results obtained (presented in graphs) and statement of conclusions relevant to the work done.
Based on the methodology described above, each phase is developed in detail below:
Phase 1. Identification of the model.
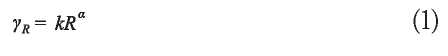
The ITU [10] [11] in the P.R838-3 standard defines the specific attenuation as follows:
Equation 1, YR shows the specific attenuation (dB/ km), where R is the rainfall intensity measured in mm/h, while k and α are constants that vary with frequency and depend on the type of polarization of the radiating antenna to be used.
The values of k and α, are calculated by [10], as follows:
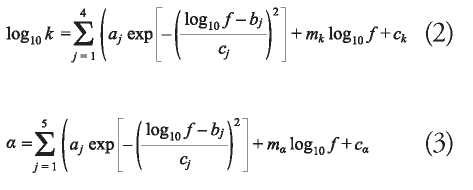
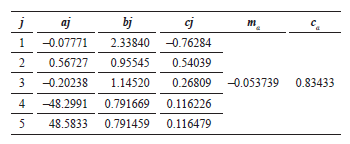
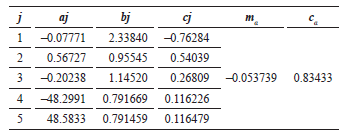
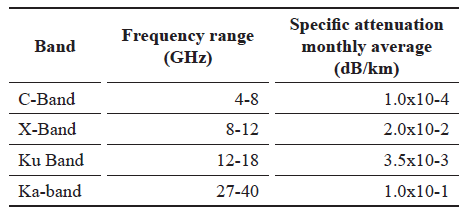
where f is the frequency in GHz, k can be kH or kV and α can be αH or αV. The ITU recommendation tables [10] show the values of the constants ai, aj, bi, bj, ci, cj, ck, ca, mk and ma, which are presented below:
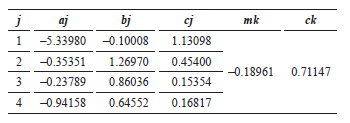
Source: ITU standard P.R838-3
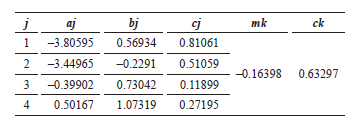
Source: ITU standard P.R838-3
Source: ITU standard P.R838-3
Source: ITU standard P.R838-3
Considering equation 1, in order to perform the calculation of the specific attenuation YR (dB/km) it is essential to know the value of R (mm/h), that is, the intensity of rainfall in the region where the calculation of radio attenuation is desired. For this study, we used the data published by the CIOH [12] in its serialized journals between 2013-2020, and averaged them for each month and year. These data is presented as intensities of mm/month so it was converted to mm/h.
Table 5 shows the summary of the average monthly values of the level of rainfall in the city of Cartagena de Indias, between the years 2013 and 2020. Due to the reduced time of observation, the value of the dispersion of the data is still high. On the other hand, it can be assumed that the annual average of this rain rate has a value of 0.112 mm/h.
Tabla 5. Average monthly rainfall for Cartagena de Indias in the period 2013-2020
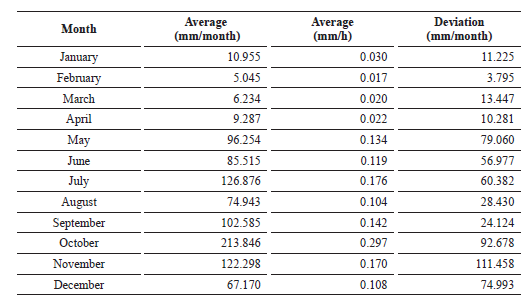
Source: Own elaboration based on the data taken from the CIOH [12]
Phases 3 and 4 of the methodology will be described in the following section.
The different scenarios proposed for phases 3 and 4 are shown below:
The following considerations have been considered for this study:
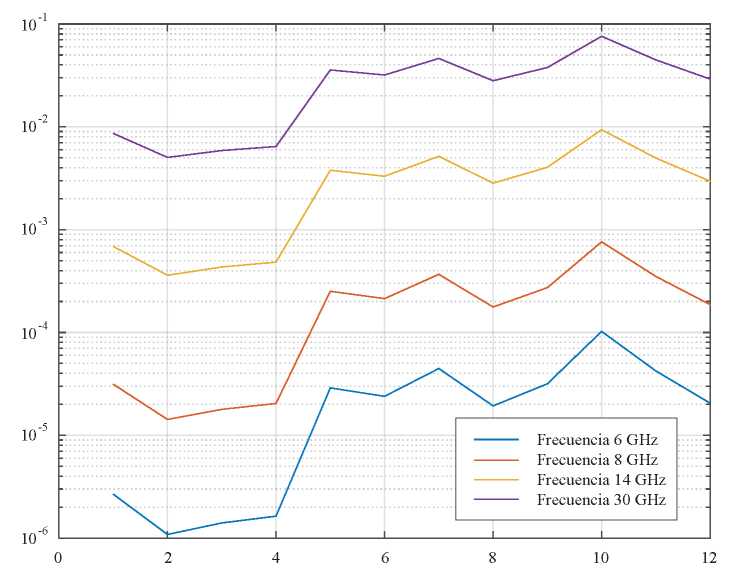
The curve with the results obtained can be seen in Fig. 1.
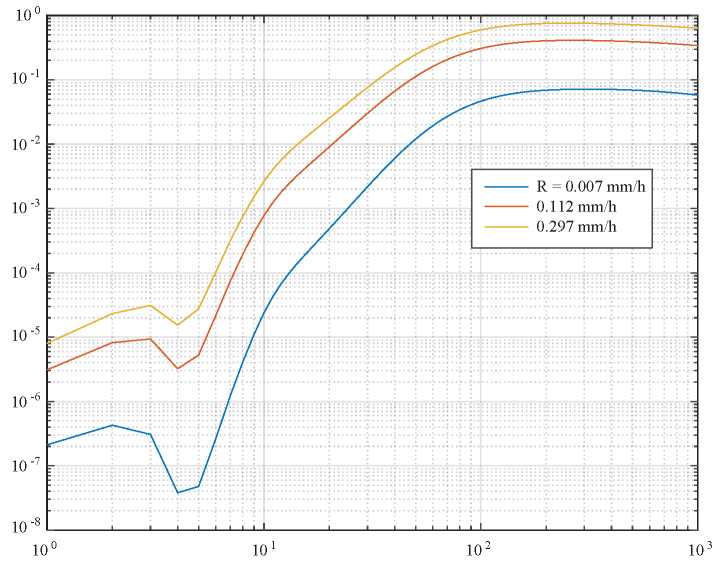
With respect to specific attenuation performance, in relation to frequency variation, three well-defined zones can be seen in Fig. 1, as follows
It is important to highlight the fact that, as the level of rainfall in a region increases, so does the specific attenuation.
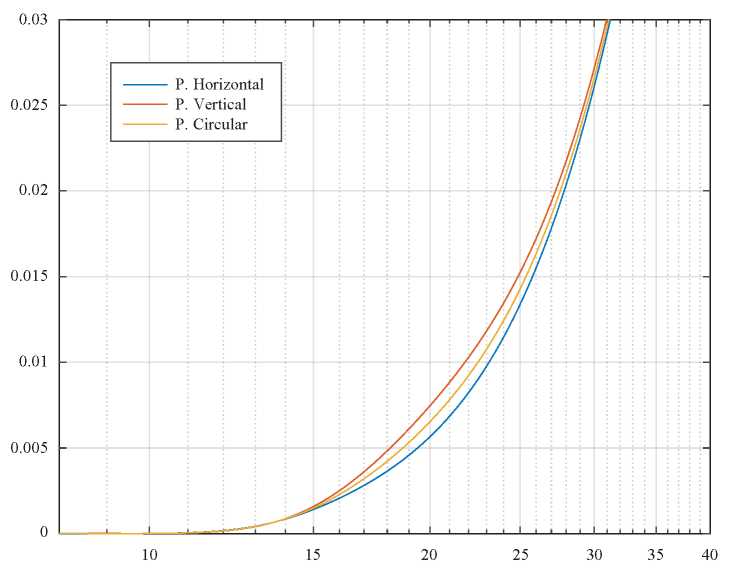
The objective of this scenario is to analyze the behavior of the specific attenuation with respect to the three types of polarization available for this kind of satellite communications: horizontal, vertical and circular.
For the simulation, the annual precipitation value previously presented is required, which corresponds to R = 0.112 mm/h; in addition, an elevation angle =θ 0° is considered, and the frequency will be allowed to vary enough to contain the C, X, Ku and Ka bands. The results of this simulation can be seen in Figs. 2, 3 and 4.
Frecuencia GHz
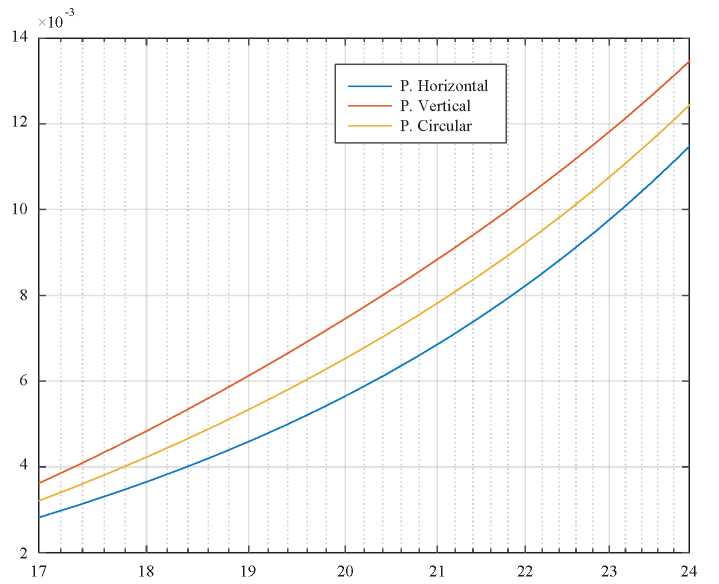
Fig. 3. Magnification of figure 2: Maximum difference between the polarizations in dB/km.
Frecuencia GHz
Frecuencia GHz
From Fig. 2, it is possible to rea ffirm what was identified in the first scenario: around the frequency of 10 GHz, the specific attenuation begins to take important values and at a high rate. However, what is new in this case, is the fact that the same thing happens for all polarizations.
The variation between the attenuations corresponding to the vertical and horizontal polarizations presented in Fig. 3 is neither constant nor uniform. For the case under study, this variation has been found to be in the range 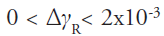 dB/km. In addition, the values of specific attenuation due to circular polarization are always equidistant to the values obtained in the previous polarizations, as can be seen in Figs. 3 and 4. However, whether it is possible to generalize or not is still to be proven.
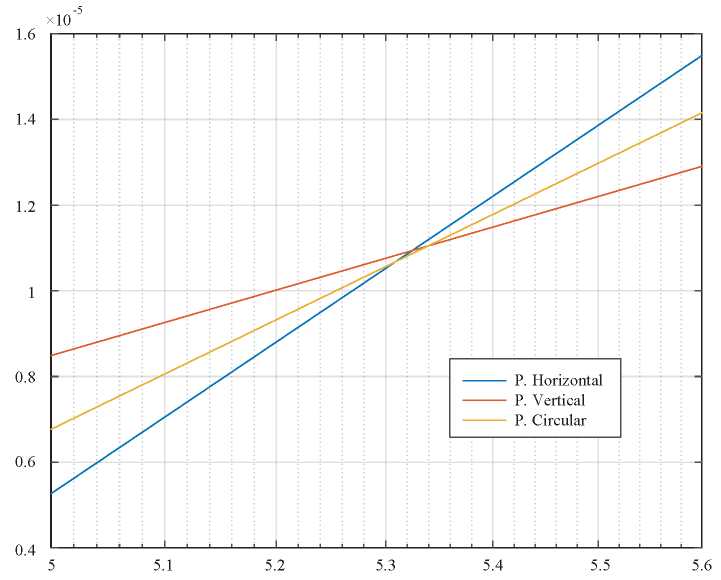
Fig. 2 shows that vertical polarization produces the greatest attenuation, followed by circular and finally by horizontal polarization. However, this behavior is atypical, since the theory explained in the literature indicates that, among all of them, the one with the greatest specific attenuation is the signal emitted by horizontally polarized antennas.
In order to analyze the described behavior, attenuation coefficient graphs were made for rainfall level values greater than and less than 1 mm/h and it was found that around this value (R = 1 mm/h) attenuation changes behavior, as can be seen in Fig. 4; that is, there is a frequency in which the polarizations vary in their performance.
For this scenario, the frequencies used in the satellite uplink models, in the C (6 GHz), X (8 GHz) -relevant because of its military use-, Ku (14 GHz) and Ka (30 GHz) bands were considered. In addition, an elevation angle equal to 0° and the average monthly rainfall levels presented in Table 5 were used. The results of this simulation can be seen in Fig. 5.
meses
Fig. 5 identifies that the specific attenuation on the communication system will increase as the frequency does; the higher the frequency, the greater the specific attenuation.
For all the simulated cases, during the months of January to April, none of the frequencies considered exceeded the specific attenuation margin of 1.0x10⁻² dB/Km.
In the case of the months between May and December, the greatest attenuation occurred in the months of July and October. The maximums recorded in the simulation are shown in Table 6, and correspond to the month of October.
For the implementation of this scenario, the angle of elevation was equal to 0°, the frequency was 6 GHz, and the way in which the different polarizations and variations in the level of rainfall during the months of the year in the city of Cartagena interact was studied. Fig. 6 presents graphically the results obtained.
Tabla 6. Average annual attenuation for horizontal polarization, 0° elevation angle.
Source: own elaboration.
Fig. 6 reaffirms what was described in previous sections with respect to signals coming from horizontally polarized antennas being the most affected by specific attenuation, followed in their order, by those of circular polarization and, finally, those corresponding to vertical polarization.
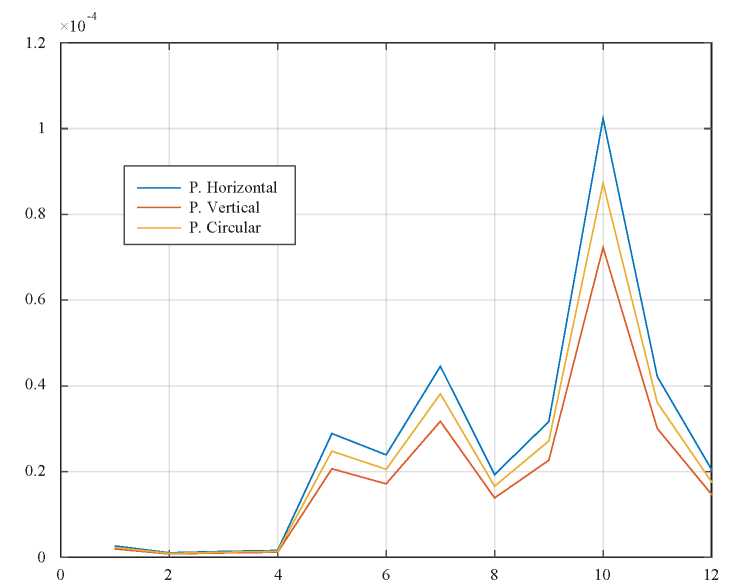
Meses
It could be observed that from January to April the specific attenuation is 0 dB/km at the frequency of 6 GHz. In addition, the two peaks of maximum attenuation occur in July with approximately 0.44x10⁻⁴ dB/km and in October with a value of 1.0x10⁻⁴ dB/km, according to what has been recorded in Table 6 for the C band.
In this section, we basically intend to analyze how increasing the elevation angle, i.e. the distance between the satellite and the transmitting station on the ground, affects the specific attenuation, considering the different working frequencies.
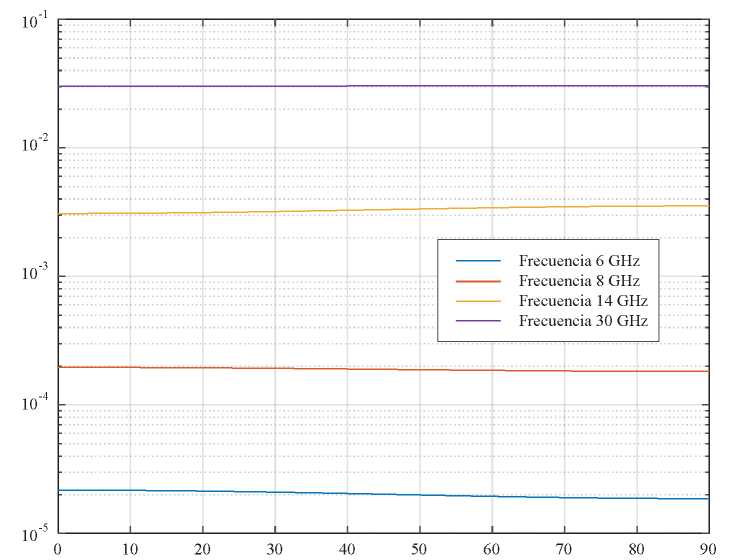
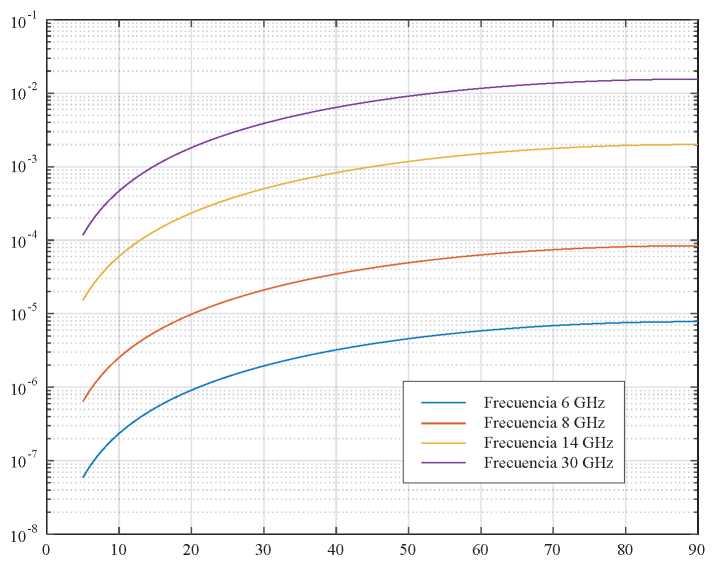
The simulations were carried out under the following conditions: elevation angle 0  θ 90° The frequencies used in the satellite uplink models in the C (6 GHz), X (8 GHz), Ku (14 GHz) and Ka (30 GHz) bands, and annual average rainfall level (obtained in this work) R = 0.112 mm/h. The results are presented in Figs. 7, 8 and 9.
From what is shown in Figs. 7, 8, 9 and 10, the calculation of specific attenuations with respect to variations in the elevation angle allows us to confirm that, at higher frequencies, there are higher levels of attenuation.
As for the behavior of the specific attenuation with respect to the polarizations of the radiating antennas, the following is stated:
Fig. 7. Specific attenuation with respect to the angle of elevation, with horizontal polarization.
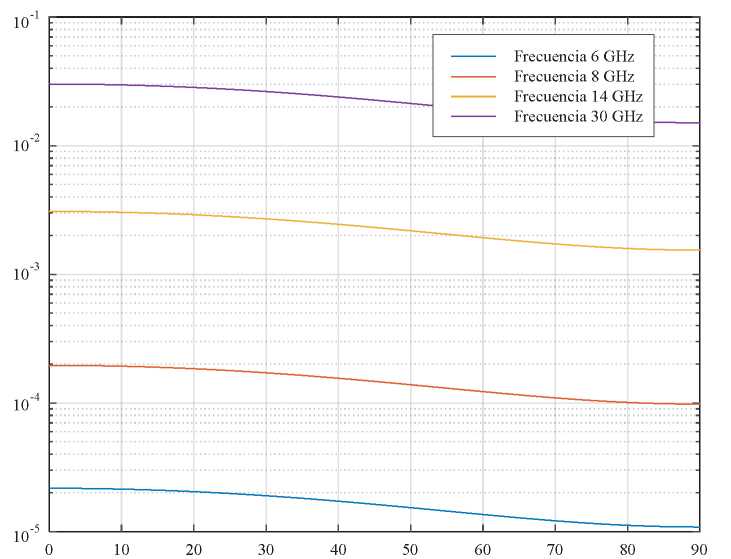
Fig. 8. Specific attenuation with respect to the angle of elevation, with circular polarization.
Angulo de elevación Grados
Fig. 9. Specific attenuation with respect to the angle of elevation, with circular polarization.
Angulo de elevación Grados
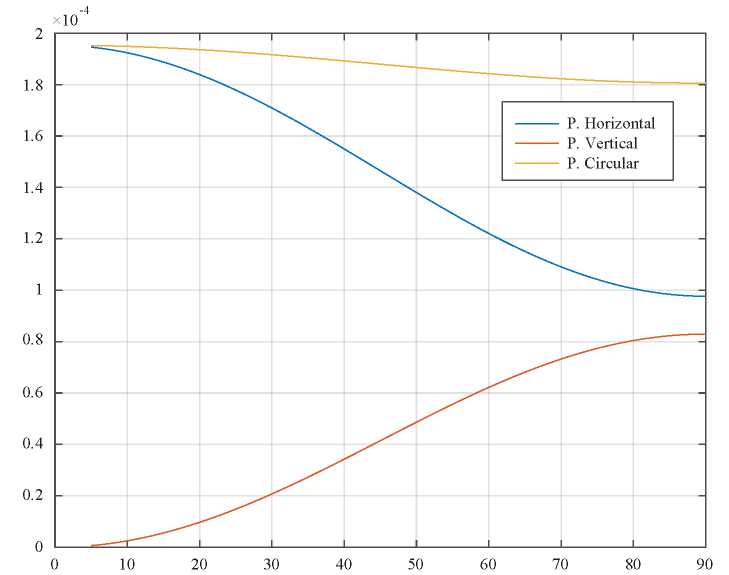
Fig. 10. Specific attenuation for different polarizations, with variation in elevation angle.
Angulo de elevación Grados
By comparing the specific attenuations according to the different polarizations and by allowing the elevation angle to vary, the greatest attenuation was found to be produced on signals with circular polarization; the least attenuation is produced on signals with vertical polarization and, finally, the signals that are intermediate in magnitude of specific attenuation are those with horizontal polarization.
The following parameters were used in this scenario:
The results are shown in Fig. 11.
Meses
As already indicated in previous analyses, between January and April the specific attenuation acquires values close to zero; on the other hand, the peaks are identified in the months of July and October.
The highest attenuations occur at the 0° elevation angle, which confirms what is shown in Figure 10 for the 8 GHz frequency.
Finally, it is important to highlight that the results of this work are of high relevance in the naval communications environment, since the operators of the onboard communications systems will be able to identify how their communication will be affected, due to rain, according to the time of the year and the satellite frequency bands.
These calculations corroborate that, under unfavorable environmental conditions, the effectiveness of information exchange systems between naval units, in microwave bands, could be affected [13] [14], so it is particularly important to include recommendations regarding the frequency bands to be used in strategic plans for the selection of communications systems for naval units, in order to minimize the probability of signal attenuation. In this regard, it would be important to include the area of operation (for example, the Colombian Caribbean) and the time of year as input parameters.
Likewise, this work contributes to the construction of a tool that allows radio operators to identify alternate frequency bands, whose wavelengths are longer and do not present significant attenuation, especially during those periods in which rain causes considerable signal degradation. In this way, a better management of the operations will be achieved and the effectiveness of the information exchange systems will be guaranteed.
The methodology presented in the ITU recommendation 838 [10] was applied for the calculation of radio attenuation in links working at frequencies of 1-100 GHz. Calculations were made to obtain the average value of attenuation in each month of the year (taking data for the period 20132020), which showed that in the months of July and October the highest values of specific attenuation corresponding to 0.44x10⁻⁴ dB/km and 1.0x10⁻⁴ dB/km, occur respectively. On the other hand, the lowest attenuation value was presented in February with a value of 0.8x10⁻⁶ dB/km.
The behavior of the variation of the specific attenuation with respect to the frequency, reflects three well defined sectors:
This behavior is the same in the three types of polarizations (horizontal, vertical and circular) so it is concluded that, as the level of rainfall in a region increases, so does the specific attenuation.
The difference between the specific attenuations, in the different polarizations, is not constant or uniform; in the case studied, there was a maximum variation of 2.0x10⁻³ dB/km between the vertical and horizontal polarization. Similarly, the values of circular polarization were shown to be equidistant to those obtained with horizontal and vertical polarizations.
The order of attenuation was found to be from highest to lowest, depending on the polarization of the signal corresponds to horizontal, circular, and vertical. However, it was shown that this is fulfilled when the value of the rainfall level is greater than 1 mm/h. For values below 1 mm/h, it was shown that there are points in the graph where the polarizations reverse that order to vertical, circular and horizontal.
On the other hand, it is concluded that the specific attenuation increases as the operating frequency increases; the higher the frequency, the higher the specific attenuation.
With respect to the behavior of the specific attenuation, and considering the three analyzed polarizations, it is concluded that: 1) for horizontal polarization, as the elevation angle increases, the specific attenuation decreases; 2) for vertical polarization, as the elevation angle increases, the attenuation also increases; and 3) for circular polarization, the specific attenuation is not affected by the variation of the elevation angle, and the difference between the maximum and minimum values of the attenuation is 0.2x10⁻⁴ dB/km.
If the magnitudes of specific attenuation according to the different polarizations are compared, by allowing the elevation angle to vary, it can be concluded that the greatest attenuation is produced on signals with circular polarization, the least attenuation is produced on signals with vertical polarization, while the intermediate signal in magnitude of specific attenuation is that with horizontal polarization.
Finally, this work contributes to the construction of a tool for the radio operators of the units afloat to identify frequency bands that do not show significant attenuations during the periods in which high rainfall rates, in the Colombian Caribbean region, imply considerable signal degradation. This tool would allow a better management of communications with a positive impact on operations, ensuring the effectiveness of the information exchange systems on board.
[1] SALOUS, S. Radio propagation measurement and channel modelling, Chichester-England, John Wiley & Sons, 2013. 424 p. ISBN 1118502329, 9781118502327.
[2] ZUBAIR, M., HAIDER, M., KHAN, S.A. & NASSIR, J. 2011. Atmospheric influences on satellite communications. Przeglad Elektrotechniczny 87 (5), 261-264.
[3] GARVIN, M. B. Launching Latin America: International and Domestic Factors in National Space Programs. Thesis of master's degree. Naval Postgraduate School. Monterey, California, 2014-12.
[4] MANDEEP, J. S., Slant path rain attenuation comparison of prediction models for satellite applications in Malaysia, Journal of Geophysical Research. 2009, Vol. 114, pp.112.
[5] NANADRA, A., GOVIL, J. y KAUR, H., Optimization of satellite link design, IEEE SoutheastCon 2008, Huntsville, AL, 2008, pp. 147-152.
[6] HENRIQUEZ, L. O., DURANTE, C., 2007. Parámetro de radio atenuación troposférica por lluvia para el Estado Zulia en el rango de frecuencias de 0.4 Ghz y 60 Ghz, Télématique, Vol. 6, No. 1, pp.1-16.
[7] KESTWAL, M. Ch., JOSHI, S., GARIA, L. S., Prediction of Rain Attenuation, and Impact of Rain in Wave Propagation at Microwave Frequency for Tropical Region. International Journal of Microwave Science and Technology, 2014, Vol. 2014, pp. 1-6.
[8] OROZCO, I., DURANTE, C., 2012. Tropospheric radioattenuation forecast for different angles of elevation in the city of Mérida between 2011 and 2014. Télématique, Vol. 11, No. 1, pp.1-15.
[9] PIMIENTA, C., DURANTE, C., 2006. Niveles de atenuación troposférica en el departamento de la Guajira, Télématique, Vol. 5, No. 2, 2006, pp. 95-109.UIT
[10] Unión Internacional de Telecomunicaciones -UIT. Recomendación UIT-R P.838-3. Modelo de la atenuación específica debida a la lluvia para los métodos de predicción. 1992-1999-2003-2005.
[11] OZUOMBA, S., Kalu, C. & ONONIWU, G. 2015. Determination of the dominant fading and the effective fading for the rain zones in the ITU-R P.838-3 recommendation. European Journal of Mathematics and Computer Science. 2015, Vol. 2
[12] CIOH. CIOH - OCEANOGRAFIA OPERACIONAL. 2020. [on line]. Available: https://www.cioh.org.co/meteorologia/ [Accessed: January 12, 2018]
[13] ALONGE, A. A. & AFULLO, T. J. Rainfall microstructures for microwave and millimeter wave link budget at tropical and subtropical sites, 2013 Africon, Pointe-Aux-Piments, 2013, pp. 1-5, doi: 10.1109/AFRCON.2013.6757852.
[14] AJEWOLE, M. O., KOLAWOLE, L. B. & AJAYI, G. O., Theoretical study of the effect of different types of tropical rainfall on microwave and millimeter-wave propagation, in Radio Science, vol. 34, no. 5, pp. 1103-1124, Sept.-Oct. 1999, doi: 10.1029/1999RS900063.
[15] CARDAMA, A., Antenas, 3rd ed. Barcelona: Universidad Politécnica de Cataluña, 2009 pp. 54-55.