Ship Science & Technology - Vol. 14 - n.° 27 - (9-23) July 2020 - Cartagena (Colombia)
DOI: https://doi.org/10.25043/19098642.202
Jorge Cárdenas Molina1
Ivonne Olguín Valenzuela 2
1 Academia Politécnica Naval. Av. Jorge Montt s/n, Viña del Mar, Chile. Email: jorge.crdenas2@gmail.com
2 Academia Politécnica Naval. Av. Jorge Montt s/n, Viña del Mar, Chile. Email: ivo.olguin.6487@gmail.com
Date Received: December 10th 2018 - Fecha de recepción: Diciembre 10 de 2018
Date Accepted: March 14th 2019 - Fecha de aceptación: Marzo 14 de 2019
The objective of this research is to apply a dynamic maintenance model to the assets of the engineering department of a navy vessel, based on the concept of reliability engineering, which analyzes the statistics of failures of different equipment, in a period of 140 months, in order to determine which is the most sensible equipment, the failure modes and the impact it produces on the ship's platform. This way, it is possible to focus on the problems that produce the biggest impact in the capacity of the Unit´s, in order to fulfill its roles, and this way, contribute increase its availability. This is an iterative process of continuous improvement for the maintenance plans.
Key words: Condition Based Maintenance (CBM), Failure Mode, Effects and Criticality Analysis (FMECA), Key Performance Indicator (KPI), Reliability Centred Maintenance (RCM), Maintainability, Reliability.
La presente investigación tiene como propósito aplicar un modelo de mantenimiento dinámico a los activos del Departamento de Ingeniería de un buque tipo naval basado en Ingeniería en Confiabilidad, el cual analiza la estadística de falla de los equipos durante un período de 140 meses para determinar la maquinaria más sensible, además de los modos de falla y el impacto que produce en la plataforma. De esta manera, fue posible concentrarnos en los problemas que producen un mayor impacto a la capacidad de la Unidad para cumplir sus roles y contribuyendo de esta manera a aumentar su disponibilidad. Éste es un proceso iterativo que busca generar una retroalimentación entre las acciones de mantenimiento con el propósito de establecer un proceso de mejoramiento continuo en los planes de mantención.
Palabras claves: Mantenimiento basado en la condición (CBM), Análisis de modo de falla, efecto y criticidad (FMECA), Indicadores de desempeño (KPI), mantenimiento basado en la confiabilidad (RCM), Mantenibilidad, Confiabilidad.
At the end of the last stage of the renewal of naval equipment, the incorporation of new units brought as a consequence the incorporation of new technologies. For engineering some advances were incorporated, for example, the replacement of steam propulsion with combined systems using diesel engines, gas turbines, electric motors, among other types of machinery.
But, as new types of technologies were incorporated, it also implied greater training for both operators and system maintainers, which also called for a modernization of maintenance policies in order to have availability of the Units that allows defending national sovereignty whenever the country requires it.
For this, the present investigation aims to implement a model of dynamic maintenance to the assets of the Engineering Department of a naval ship, based on engineering in reliability, which analyzes the statistics of failure of machinery equipment to determine the most sensitive, in addition to the failure modes and the impact on the platform.
In this way, it seeks to optimize maintenance efforts, concentrating on the problems that produce a greater impact on the capacity of the Unit to fulfill its roles and thus, contributing to increase its availability. This is a continuous and iterative process that seeks to generate feedback between maintenance actions and equipment failures, in order to establish a process of continuous improvement in maintenance plan.
The organizations have felt the need to improve all the techniques related to the management of their assets. That is why reliability engineering was born as a way in which these processes can be optimized through effective and efficient maintenance policies developed based on pieces of equipment that directly affect their availability or productivity. From this perspective, the system that is under investigation must be able to answer the following questions: what are the functions of a piece of equipment?, in what way can it fail?, what causes it to fail?, what happens when it fails? What happens if it fails? What can be done to prevent failures? and finally, what happens if the failure can't be prevented? These questions were summed up by Moubray (2004) for the study of Reliability Engineering based on the RCM.
With this questioning, the Engineering in Reliability allows to delve into concepts related to the reliability, maintainability and availability, all based on statistical resources for the analysis or evaluation of improvements, design, forecasting and maintenance of the machines to reduce costs and obtain customer satisfaction regarding to the equipment. For this, the phases that will be mentioned below must be carried out.
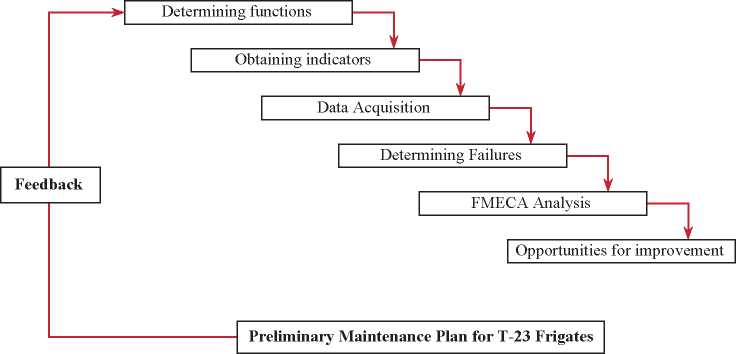
Stage 1: List of functions. In this incipient stage it is necessary to identify and define the primary functions (those that fulfill the main task the asset was acquired for) and/or secondary (additional tasks) of the systems of a company or institution associated with a specific area, in order to contextualize their operation.
The logical-functional representation of the system will be preponderant through the creation of block diagrams known as RBD (Reliability Block Diagram), with which it is possible to perform a graphical analysis of the connection of components according to their logical relationship.
Stage 2: Obtaining performance indicators. Once the historical background associated with its logical-functional representation has been obtained, it is necessary to establish performance indicators also known as KPI or key performance indicators that allow the identification of cost reduction, improvements in processes and productivity. For example: the frequency of failure or MTBF, unscheduled downtime, level of impact to the operation (percentage given by the user) and/or reliability.
Fig. 1. Stages of Reliability Engineering [Own Development].
Each institution or organization must be able to establish the characteristics and/or parameters that will contribute to the identification of the sensitive equipments of each organization, and it will finally contribute to the determination of where to focus the efforts to perform the Failure mode, effects and criticality analysis (FMECA).
Stage 3: Data acquisition. Each organization must have a complete list of their equipment, classified into main or auxiliary systems, which must be hierarchized according to the consequences they have on the operation of the company and/or institution through a survey of historical data that "results from both planned and unplanned detentions, of both the maintenance and operation of the plant or fleet under study"(Arata, 2013, p.121).
Stage 4: Determining failures. Failures are defined as "the inability of a good to fulfill the functions that the user expects it to perform" (Moubray, 2004, p.45), since it has caused an alteration in the components or in the operation. The study considers both the main faults that prevent the system from fulfilling its function and the secondary faults which do not make the operation of the equipment impossible, but supposes an abnormal operation.
Stage 5: Determining modes of failure (FMECA). The FMECA is specified as "a qualitative and structured analysis performed on a system, subsystem or function, used to identify their potential failure modes, their causes and their effects associated with each of those" (Bowels and Bonnell, 1998, p.2) in order to determine new policies and avoid unscheduled stops in case of failure. Therefore, the failure modes are all those events or reasons that can generate a functional failure in the system, such as the causes related to the design, assembly, the state of a component, the operation, maintenance failures, abnormal external conditions or as a result of another malfunction.
In order to establish an adequate strategy for the management of failures, it is necessary that each mode contains enough details so that a finished analysis can be carried out at different depth levels. A useful way to study the modes can be through the following strategies:
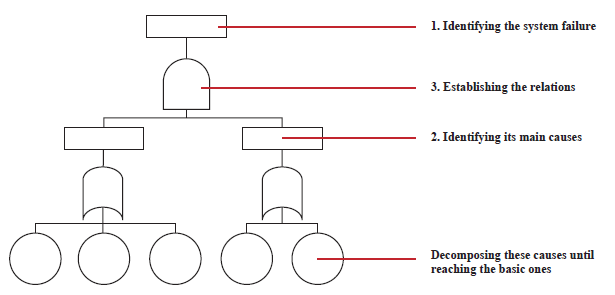
Failure Tree Analysis (FTA). It is a deductive process used to determine the combinations of failures by conditions such as diminution of systems performance, safety or other operational attributes that have the potential to contribute to their occurrence. It can also be used to calculate the probability of occurrence of a main event of failure using analytical or statistical methods, contemplating the probability of basic events in a time interval.
Fig. 2. Failure Tree Analysis.
Pareto Analysis. This analysis is a quantitative comparison of factors in a higher to lower fashion according to their contribution to a given effect. It is represented by means of a histogram, in which the factors are classified as "unimportant" (very important elements) to the "very trivial"(the unimportant elements). With this graphical representation of a Pareto Analysis, it was concluded that 20% of the causes generate 80% of the total faults.
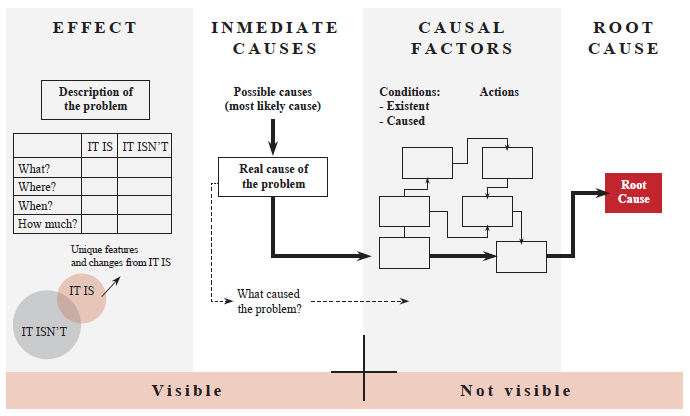
Root cause analysis. An analysis in which the causes of failures are identified to avoid their recurrence through a process that aims to achieve continuous improvement. This methodology functions to reveal problems and solve them, so the difficulty must be dealt with exhaustively on each of the actions that could have generated the failure.
Fig. 3. Example of a Pareto chart
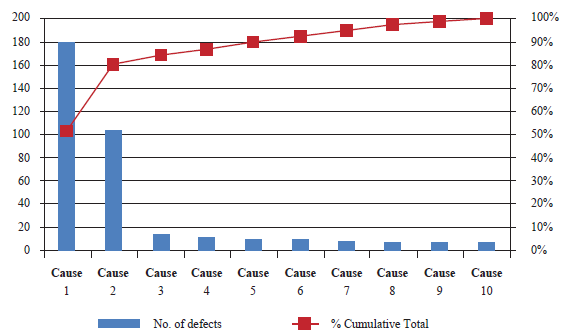
Fig. 4. Root Cause Analysis Chart
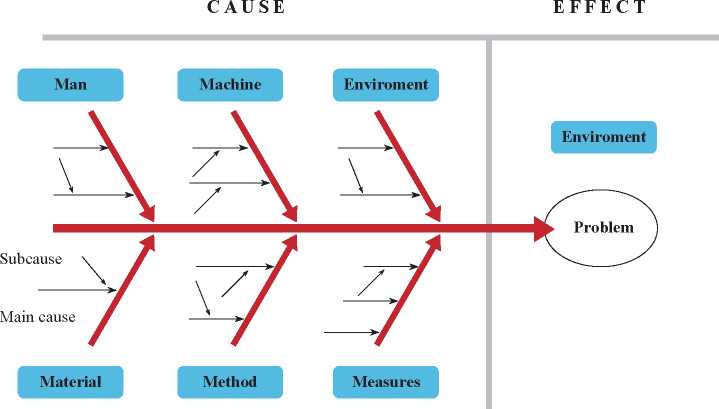
Ishikawa's Chart . It is a cause - effect diagram that consists of the graphic representation of a problem in the horizontal plane, representing the problem to analyze, with its respective causes as it is taught (see Fig. 5).
Stage 6: Analysis of effect and criticality (FMECA). Once the failure modes have been identified, it is necessary to know the consequences and the criticality of these, since, when evaluating the importance of each failure. It is necessary for Engineering in Reliability to assess the following three aspects (García, 2015, p.145):
Evidence of a failure. Sometimes some flaws may be hidden in the system, because they do not have any symptom that could be evidence for this. Apparently, they do not have consequences until they become dormant or until they lead to multiple failures. This is different when the fault is detectable from the moment it occurred.
Fig. 5. Ishikawa´s Diagram [16]
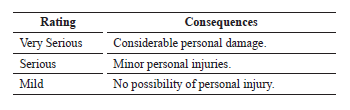
Criteria of consequences of failure.
Personal Safety
Tabla 1. Consequences for personal safety [10]
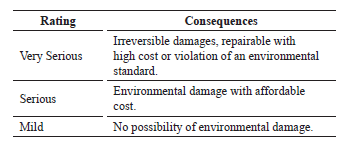
Environmental Impact
Table 2. Consequences for environmental impact [10].
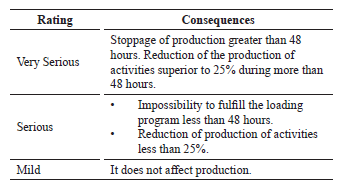
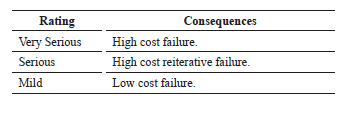
Production
Table 3. Consequences for production [10].
Repair Costs
Table 4. Consequences for personal safety [10].
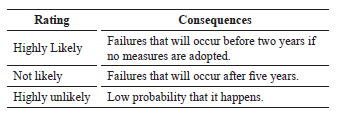
Probability that the failure will occur
Table 5. Probability of Failure
The combination of the weights in each of the three conditions will allow faults to be classified into four categories: insignificant, bearable, significant and critical failures typical in sensitive equipment identified by each organization). This is just one of the many examples for the creation of a risk matrix.
Stage 7: Preventive measures. In this stage the preventive measures to be adopted must be determined to avoid any potential failures (García, 2015, p.149) , such as: implementation of improvements and modifications in the installation, modification of operation and maintenance instructions, scheduled maintenance tasks, training for operators and users.
The maintenance task can be classified in:
Basic tasks such as sensory inspections, reading and history of parameters, lubrication and replacement of parts with low cost.
Significant tasks corresponding to the basic tasks plus parameter measurement with external elements, verification (clearance, alignment, tightening, among others), replacement of parts in wear and clean condition.
Systematic tasks that constitute the sum of the previous tasks (basic and significant) plus the calibration of measuring instruments, reengineering and systematic replacement of wear parts.
Stage 8: Grouping of measures. Prior to the implementation of the measures and with the aim of facilitating this task to avoid potential failures in the machinery, they are grouped into the following categories: list of preventive measures in case of failure, maintenance plan according to modifications, training and spare parts list.
Stage 9: Implementation and monitoring. Once the previous phases have been concluded, the analysis and economic evaluation of the identified improvement opportunities must be executed to be subsequently defined in a global asset management and implementation plan. The idea of this procedure is to be constant feedback to generate continuous improvement.
From a methodological point of view, this work was identified as an Applied Research (also known as practical or empirical). That is, by means of the knowledge acquired in addition to the results of the work generated a rigorous, organized and systematic way of knowing the reality which allowed the preliminary design of improvements to the maintenance plan for the naval ship in which tools were used such as data analysis, failure rates and respective criticality to investigate, analyze and determine improvements to a given system.
Th rough this work we sought to study "the effects of current naval ship maintenance policies on the availability of the Unit" with the aim of providing new technical criteria to finally establish a preliminary design of improvements to the plan of current maintenance using Reliability Engineering.
Therefore, the developed strategy was the methodical study of the failures from the point of view of Engineering in Reliability. This analysis process allowed us to apply measurement parameters and data analysis through the implementation of the four stages described below:
Stage 1 "Determining Sensitive Equipment".
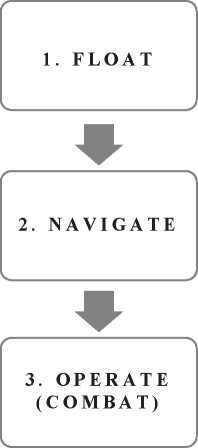
Methodology. For this first step it is necessary to define the functions that pertain to the ship's engineering systems, with the purpose of contextualizing its operation according to three pillars that the Combat Units must comply with.
Once hierarchized, it is essential to associate these capabilities with the block diagrams (RBD) of the existing engineering area systems on board the Unit from the point of view of a functional configuration. That is, to establish a logical-functional representation that allows to graphically identify the interdependence of different equipments in front of the aforementioned functions. Broadly speaking, an example of the above is shown in Fig 7.

Information Analysis. For the development of this phase, the hierarchy of the functions of floating, navigating and operating was defined. Undoubtedly, the most important function in a ship is to "float", since otherwise it would be impossible to develop any of the other functions. Then the "navigating" function was considered as a secondary function, since the analysis was carried out from a logistical perspective and, finally, the task was to operate.
The systems of the ship are oriented so that they can comply with the aforementioned functions; in this way certain dependencies are generated between the systems, which cause the failure in one of these to prevent the Unit from being able to develop a specific function. For example, for the function to navigate it is necessary that at least the motor, the line of axis and the propeller are operational, otherwise, the ship will not be able to fulfill its operational role.
As a result of this, the block diagrams of the naval ship's equipment were elaborated based on their configuration and reaching up to the third level defined in the Manual ofCodification of the Ship's Components Systems.
The dependence of these systems and the function to which they are associated that will affect later to determine how sensitive they are according to the function that allows them to develop, was appreciated. It is important to mention that for the purposes of the study, the "float" function was dispensed with, since it has little associated failure statistics.
Methodology. For this phase, the KPIs (Key Performance Indicator) should be selected to provide information regarding the performance of the systems of the Naval Ship Engineering Department, with the objective of making a diagnosis of the reliability and availability of the Sensitive Equipment.
Results of the investigation. The performance indicators selected for this work are:
Methodology. The collection of historical data, both from the planned stoppages and those that happened unexpectedly on the naval ship, was carried out by means of the collection of information extracted from the historical record of failures.
To this end, the failures of the Engineering area of three naval vessels of the same type (mentioned as BN 1, BN 2 and BN 3 to maintain the reservation of their names during the investigation) were considered over a period of 140 months, specifically, between the January 1, 2007 to May 31, 2016, adding a total of 4,396 which are divided into:
Table 6. Failures in Type 23 Frigates [Own Elaboration].
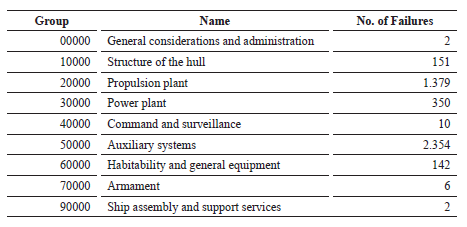
Results of the investigation Of the 4,396 failures linked to the Departments of Engineering of naval ships, it can be seen that.
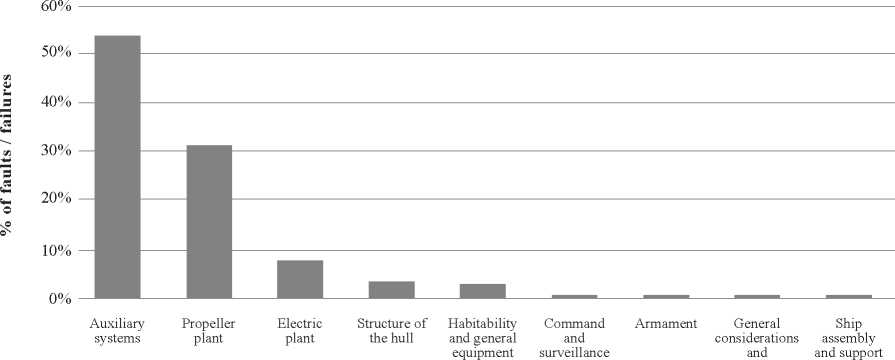
Information Analysis. Based on the previous table, a histogram was generated that represented the statistical behavior of the faults of the naval ships, having a greater tendency in the Auxiliary Systems (53.55%), Propulsion Plant (31.37%) and Plant Electrical (7.96%), concentrating in these 92.88% of the total cases, which are related to the systems that contribute in the fulfillment of the functions of floating and navigation mentioned in predecessor phases. The rest of the groups, although they fulfill a certain role in the Unit, did not have a greater incidence in this investigation.
Methodology. As it was mentioned before, the statistical analysis of failures included the study of 4,396 events, whose data in this particular phase were grouped by means of Pareto Diagrams or Histograms, and analyzed from three perspectives: number of faults linked to assets, relative frequencies (percentages of failures in each equipment) and accumulated frequency (percentage of failures that are added up to complete the absolute 100%).
Table 7 . Distribution of the failures of the three naval ships [Own Elaboration].
Fig. 8. Fault histogram according to configuration [Own Development].
Distribution of faults according to configuration
From the table described in Phase 3 "Acquisition of data" it was possible to identify and quantify not only those equipment with a high failure rate, but also those functional elements that constitute it and whose accumulated percentage was transcendental to determine those assets that grouped 50% of these.
With this information, the hierarchy process was originated through the use of two types of coefficients, one by frequency and the other by the criticality in the process they develop. The multiplication of both factors, finally, gave the order to the importance (sensitivity) of the equipment to delimit those sensitive assets that were the object of the FMECA study.
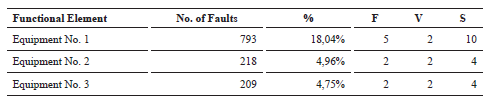
Results of the Investigation. Out of the more than 4,000 faults, information was grouped into a total of 269 equipments. The variations of the frequencies in the functional elements ranged from the 793 failures for Team 1 to a failure for other equipment, so there was a wide range of distribution.
To analyze the amount of information obtained, for this phase the cumulative frequencies (% ac.) up to the second quartile were considered, concentrating the data on 13 functional elements (See Table 8).
Table 8. Fauls of Naval Ships (frequency accumulated up to 50%).
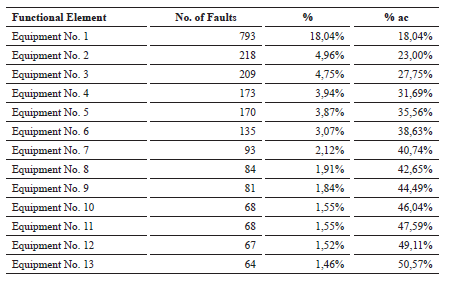
Information Analysis. An important part of the work of this phase was executed when ordering the information of the record history since it was possible to determine the amount of events associated to the Engineering teams of the naval ships. However, another part of the objective was to specify the sensitive assets related to these faults, so it was necessary to carry two filters for their selection. The first one was carried out when selecting the 13 functional elements (out of 269) whose percentage of failures accumulated up to 50% of the total and the second by means of frequency, function and sensitivity indicators.
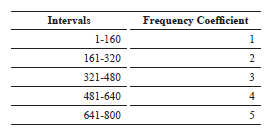
Coefficient of Frequency (F). As explained above, the wide range of frequencies for each of the systems represented a difficulty when calculating them criticality. If the nominal statistical values were considered, the frequency coefficient would have an equally dispersed behavior to the number of faults, distorting definitively the information at the time to carry out the selection.
Therefore, the frequencies of the data were distributed into 5 groups in intervals of 160 faults each, completing a total of 800 at the last level. Each rank was associated with a number from 1 to 5 in ascending order (See Table 9).
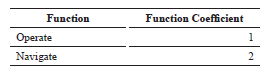
Function coefficient (V). The systems must be able to contribute to the fulfillment of the functions of floating and navigating of the Combat Units, each of them with a greater or lesser degree of interference as indicated in the Table 10.
Table 10. Function Coefficienct.
Sensitivity (S.). Multiplying the aforementioned coefficients, it was possible to obtain the calculation of the sensitivity of the assets according to the number of failures and their respective function to determine the hierarchy of the functional elements.
Once the hierarchization process for the delimitation of sensitive assets was completed, the process was based on selecting the functional elements that have a criticality value greater than 1 and that, therefore, were characterized as having a high frequency coefficient or a high coefficient of function and even both possibilities, as indicated in the Fig. 9.
Fig. 9. Sensitive assets of naval vessels.
Up to this point, the Investigation concentrated its efforts in organizing the existing information with the purpose of generating failure statistics with the analysis of the information and without any knowledge on the naval ship, except for what is described in the historical records of failures to determine the sensitive assets described above.
For later stages, only Equipment No. 1 will be considered.
Stage 2 “FMECA”
Phase 1: Determining Components.
Methodology. In this phase, the components associated with Equipment No. 1 were studied in depth. To do this, it is necessary to rigorously review the historical data and their respective technical manuals to determine the source of equipment failures given the amount of components that resulted in each one of the assets.
Results of the Investigation.
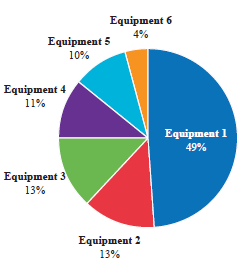
Equipment No. 1
Out of the 793 failures recorded for this team, it was finally possible to group a total of 144 components. However, due to the large number of elements for the elaboration of the Pareto Diagram, it had to be pointed out in those 16 systems that showed a 50% of failures accumulated.
Table 11. Sensitivity calculation.
Information Analysis.
Equipment No. 1
Out of the total faults, 116 of them (equivalent to 14.63%) were related to Component 1 during the course of the 140 months, registering 38, 27 and 51 for the naval ships BN1 - BN2, and BN3 respectively.
Most of the failures were of an ordinary nature, which implies 93.1% of the events. The mentioned data is not irrelevant, since the high percentage of events linked to this asset has required a constant effort of predictive work to avoid and/or mitigate its effects in the three Units.
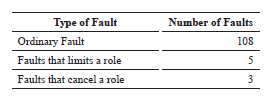
Phase 2: Determine failure modes and effects.
Methodology. The FMECA was the technique used at this stage to identify and list the possible failure modes that were related to the components that were individualized in each of the sensitive assets of the Units in question during the fulfillment of their operational requirement, such as for example inadequate opening of valves, shortcircuit, material wear, inadequate control system, handling damage, range out of tolerance, among others, as well as the effects and/or consequences of each of these situations on the operation of the system in general.
Table 12. Types of Faults Equipment No.1.
Analysis of the investigation.
Equipment No. 1
The technical details of the failure mode of Equipment No. 1 and the components involved in them can't be revealed in this report.
Phase 3: Implementation of Risk Matrix.
Methodology. To assess the risk of failures in sensitive assets, first, the sensitivity of the assets and their respective components were diagnosed, for which the risk matrix of the British Royal Navy related to the maintenance assessment defined by the Ministry of Defense was used as a basis through the standard DEF STAN 02-45 that includes the analysis of the history of the defined systems, combining two aspects:
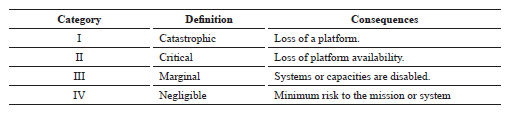
Impact. They are referred to the consequences of failure modes. It is usual for this table to consider the dangers in personal safety, economic and environmental impacts and the operational matrix that was used for the sensitive assets of the compliance of the Unit under four types of naval ship under study, only the operational impact conditions: catastrophic, critical, marginal and had direct incidence with this study.
Fig 10. Pareto Diagram Equipment No.1.
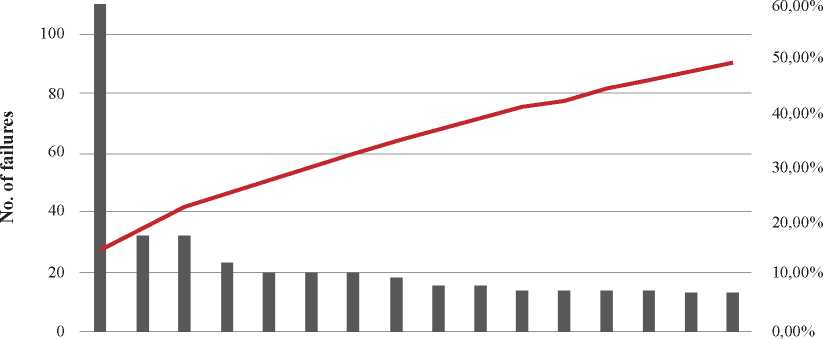
Table 13. Categories of impact
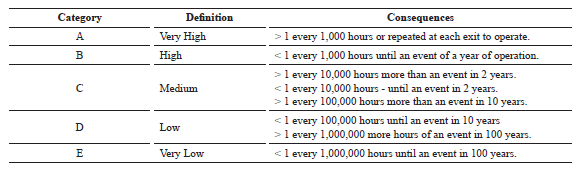
Probability of occurrence of failure modes.
Table 14. Levels of probability of failure
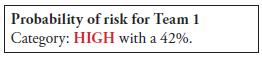
The probability of occurrence of the faults was superimposed with the impacts of the failure modes (frequencies). These criteria are used to identify and compare the relative consequences of the events of critical assets through the use of this matrix. On the other hand, DEF STAN 0245 established an associated percentage for each of the conditions, finally represented in the boxes of the table. The position of the failure mode indicates four levels of risk: high, medium, low and acceptable represented in the figure with the color red, yellow, blue and green respectively. The interpretation of this information will depend on the criticality percentage indicated in Table 15.
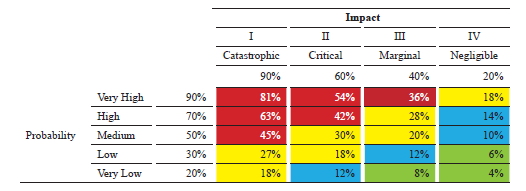
Table 15. Levels of probability

Results of the investigation.
Equipment No. 1
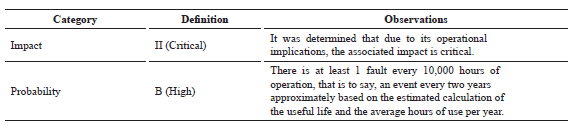
Analysis of the investigation. To obtain the results of the risk matrix, it was necessary to establish certain considerations to determine the probability of occurrence of failure modes, such as the average lifespan and average hours of use of Equipment No. 1.
For both, an average of hours was calculated according to the experiences obtained from one of the three naval vessels, which were extrapolated for the rest of the Units, since they have had a similar behavior.
Stage No. 3 “Maintenance plan versus FMECA results”
Methodology. The systematic execution of the previous stages provided the opportunity to study the systems of the Department of Engineering of the naval ships by means of their respective statistics of failures. It was therefore necessary to carry out the criticality analysis from two points of view: the first to determine the sensitive assets on which the study's efforts were to be focused and the second through the results of the application of the risk matrix of the FMECA for the components whose percentages of failures predominated in the selected systems.
After having identified the functional elements, in this new phase we proceeded to distinguish the potentials and limitations of their respective maintenance plans, in order to implement a maintenance plan based on new technical criteria which arose from visits to competent technical entities, operators and maintainers specialized in the naval ship to study.
The technical consultancies were assisted by the Officers and those in charge of the relevant areas, who not only assisted in the understanding of the modes of failure of the assets, but also collaborated in proposing solutions to increase the reliability and availability of the systems.
Results of the investigation. The maintenance plan for Team 1 contemplates compliance with various tasks, which must be carried out at different time intervals, which can't be revealed in this report. In addition, it should be noted that due to the high failure rate of Component 1 of Team 1, the monitoring of this component was increased, being able to predict the moment in which it needs replacement, which does not coincide with the maintenance routine that contemplates it, that is, the replacement must be done earlier than what is programmed according to the factory maintenance plan.
Analysis of the investigation. Instead of a monitoring by condition that allows to measure Component 1 more frequently, which has been an efficient measure in order to carry out a predictive maintenance of the failure, it is necessary to implement solutions that are effective to increase the life useful for this component. Since, while the failure is being constantly monitored and, therefore, thanks to this measure is an event controlled by its maintainers, it is still necessary to replace it before its maintenance plan.
Table 16. Guideline for determination of criticality of Equipment No.1 [Own Elaboration].
1. Reliability Engineering is the procedure that, through analytical tools, provides an opportunity to implement improvements both in management areas and in the maintenance plans of those assets with failure rates that affect the reliability and availability within a certain Organization.
2. After performing the analysis of the naval ship's fault statistics, Equipment No. 1 was identified as a sensitive asset, product of the frequency of the fault statistics and interference in the impact they produce on the functions at the moment of floating, navigating and operating in unit.
3. After comparing the original maintenance plan, based on the recommendations of the manufacturers, with the results obtained from the FMECA analysis, improvements were proposed in the incorporation of maintenance tasks for Equipment 1, which can't be detailed in the present report.
ARATA, A. & ARATA, A. (2013). Ingeniería de la Confiabilidad. Teoría y aplicación en proyectos de capital y en la operación de instalaciones industriales a través del enfoque R-MES. Chile: Ril Editores.
BONNEL, R. Y BOWELS, J. (1998). Failure Mode, Effects and Critically Analysis. Simposium Anual de Confiabilidad y Mantenibilidad. Estados Unidos.
Consultoría de Proceso. Análisis de Causa Raíz. Recuperado: 22 de junio de 2016, de: http:// www.consultoriadeproceso.com.mx/causaraiz. html
DURÁN, J. (2012). Gestión de Mantenimiento bajo estándares internacionales como PAS 55 Asset Managment. Recuperado el 9 de abril de 2016, de: http://www.mantenimientomundial.com/ sites/mm/notas/PAS55.pdf.
ESPINOZA, F. (2013). Confiabilidad operacional de equipos: metodología y herramientas. Chile: Universidad de Talca. Recuperado el 11 de febrero de 2016, de: http://docplayer. es/6350864-Confiabilidad-operacional-deequipos- metodologias-y-herramientas.html.
GARCÍA GARRIDO, S. (2015). Ingeniería del Mantenimiento. Volumen I y II. España: Renovotec Editorial.
MESA, D., ORTIZ, Y. & PINZÓN, M. (2006). La confiabilidad, disponibilidad y mantenibilidad, disciplinas modernas aplicadas al mantenimiento. Volumen XII, p. 155 -160. Colombia: Scentia Et Technica.
MOUBRAY, J. (2004). Mantenimiento centrado en la confiabilidad. Estados Unidos: Industrial Press Inc.
MUÑOZ, M. (2009). Mantenimiento Industrial. España: Universidad Carlos III de Madrid. Área de Ingen-iería Mecánica.
REYES, P. (2007). Análisis del modo y efecto de fallas (PMFEA). Recuperado el 25 de agosto de 2016, de: http://www.icicm.com/files/ PFMEA.doc.
WORDPRESS (2011). Análisis de la fiabilidad de equipos. Recuperado: 23 de abril de 2016, de https://sistemasmanufactura.files.wordpress. com/2011/05/sesion-22.p