Article
Ship Science & Technology, 11(21), 89-102 - July 2017
DOI: 10.25043/19098642.151
Design and development of route planner for Unmanned Surface Vehicles
Diseño y desarrollo de un planificador de rutas para vehículos de superficie no tripulados
Vladimir Díaz Charris 1 Juan A. Contreras Montes 2
1 Mechatronic Engineer, M.Sc.(c) Electronic Engineering of University of Cauca — UNICAUCA and Naval Academy “Almirante Padilla” - ENAP, Researcher at COTECMAR, Cartagena, Colombia. Email: vdiaz@cotecmar.com
2 Electrical Engineer, PhD. In Technical Sciences, Research Director In Naval Engineering at ENAP, Cartagena, Colombia. Email; epcontrerasj@ieee.org
Date Received: May 10th 2017 - Fecha de recepción: Mayo 10 de 2017
Date Accepted: June 6
th 2016 - Fecha de aceptación: Junio 6 de 2017
Abstract
This paper describes the development of a route planner for Unmanned Surface Vehicles (USVs) focused on the study of an operational scenario for a specific mission — Anti-Submarine Warfare (ASW). Through the design and implementation of a simulation model, the effect of the different factors that particularly influence ASW is analyzed, such as search pattern, speed and sensor type; dipping sonar or towed array sonar (TAS). By obtaining a measurement of effectiveness, the USV's response in the deployment of this type of mission can be defined using time to detect the threat in a search area, as parameters to measure the performance.
Key words: Unmanned Vehicles, USV, Searching Patterns, ASW, Sonar, Dipping Sonar, TAS, Effectiveness, Navy.
Resumen
En este artículo se presenta el desarrollo de un planificador de rutas para vehículos no tripulados de superficie (USVs) orientado al estudio de un escenario operacional para una misión en particular — la guerra antisubmarina (ASW). Por medio del diseño e implementación de un modelo de simulación, se analiza el efecto de los diferentes factores que influyen particularmente en la ASW, como son el patrón de búsqueda, la velocidad y el tipo de sensor; sonar de profundidad o sonar remolcado. Se aprecia mediante la obtención de una medida de efectividad, la respuesta de los USVs en el desarrollo de este tipo de misión, usando el tiempo para detectar la amenaza y la detección de la amenaza en un área de búsqueda, como parámetros para medir el desempeño.
Palabras claves: Vehículos no tripulados, USV, Patrones de búsqueda, ASW, Sonar, Dipping Sonar, TAS, Efectividad, Armada.
Introduction
For the accomplishment of missions with unmanned surface vehicles (USVs), it is very important to have tools that allow the prediction or estimation of the time, trajectory, performance and effectiveness in the accomplishment of tasks, and even more so when taking into account the complexity of performing specific missions such as Mine Countermeasures (MCM), Anti-Submarine Warfare (ASW), Maritime Security, Surface Warfare (SUW), Special Operations Forces (SOF) Support, Electronic Warfare (EW) and Maritime Interdiction Operations, which are common for this type of vehicles. [1].
This research focuses on the development of a model to replicate a particular ASW scenario using different computational tools such as Matlab® and Labview®. Expert assessment identifies a possible operational scenario and different factors that could influence the increase or decrease of mission effectiveness, including search patterns, the type of sonar, speed, direction of search, the starting point of the search and the number of USVs. Based on these factors, a method of evaluating effectiveness is explored and the relative impact of the different factors on the success of the mission is investigated through experiment design and different sensitivity analyzes.
Development
Anti-Submarine Warfare - ASW
ASW consists of the purpose of finding, tracking and damaging or destroying enemy submarines. To perform the detection of an ASW threat, equipment such as sonobuoys and different types of sonars that differ in their mode of operation are used; Helmet sonar, Dipping Sonar, TAS - Towed Array Sonar [2]. These sensors perform the first detection, then using specialized equipment the classification of the type of unit and subsequent monitoring and neutralization is performed using torpedoes or mines. Within the detection of a submarine, there are parameters such as the speed of sound in the water, temperature and salinity profile, type of background, depth, among others, that must be taken into account to achieve a high detection probability.
According to the assessment of experts an operational scenario is determined, which consists of the port exit with submarine opposition, where the threat is greater due to the complex conditions of sonar detection in shallow waters. The submarine will always be in an advantageous position for an attack because the surface units will not be able to start ASW operations until they have crossed the channel or completed the port exit.
Unmanned surface vehicles in ASW
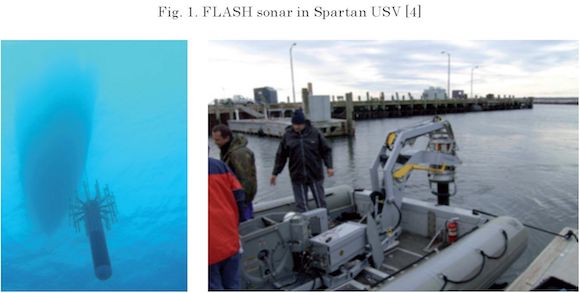
General Dynamics has been designing USVs since 2006, using sonar sensing equipment specially modified for this type of craft [3]. In 2004 Thales implemented the FLASH Dipping Sonar in the ACTD Spartan USV, see below, and it was tested in Brest Bay in mid-2006 where it demonstrated its ability in shallow waters in sprint & dip operations which means to advance and submerge. See Fig. 1.
On the other hand, it is important to highlight the USV Darco, which is a USV with a multiconfiguration for Antisubmarine warfare. This USV can be equipped with torpedo launchers, depth sounder, Active Source and towed Sonar. The USV Darco is a development proposed by the company General Dynamics that seeks to supply this type of USV for the Litoral Combat Ship -LCS type ships of the US Navy. [5]
Movement patterns for naval missions
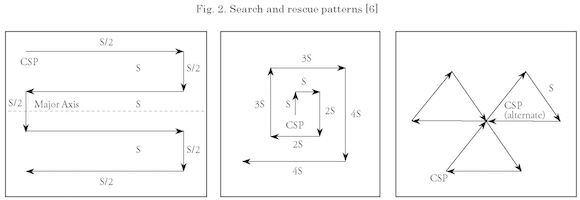
Search patterns are commonly used in different scenarios where it is required to optimize and follow an established order in order to optimize time and increase the probability of detecting the target, whether they are threats or any element of interest. The patterns are very specific according to the doctrines and necessity of each country's Navy, however the patterns, as shown in Fig. 2, correspond to those commonly used for different scenarios and which serve as input for the generation of ASW search patterns. Each pattern has a trajectory starting point that is CSP, leg lengths or trajectory with no change of "s" course and courses preset through a previous phase of mission planning.
Pattern assessment methodology
In accordance with the methodology proposed by [7] and [8] to develop models that are able to be evaluated by simulation of discrete events, the following process is proposed:
- Define mission requirements
It is necessary to have the objective to be accomplished within the mission defined, to know the threat to be faced, the operating environment and to specify an operational situation (OPSIT1) as a validation point. Based on the above, the blockade of a maritime route by an enemy submarine force type 212 [9] is defined and USVs stand out as support units to carry out the mission. Spartan Scout USVs [10] are equipped with the necessary sensor to detect and track submarine type threats in an area near a fuel refueling point.
- Identify evaluation requirements and metrics
Adapted from [7], it is proposed to use the following parameters for evaluation
- The factors or variables are simulation parameters which can be manipulated, such as the number of USVs, the search pattern, sonar type, search direction and search start point.
- Measures of Performance (MOPs) will be used as metrics related to the tasks required for a particular mission.
- Measures of E ffectiveness (MOE) are measures of mission operational performance and are calculated on the basis of MOPs.
- Development of computational models
- Evaluation of the characteristics of the simulation and its impact on the performance of the mission
For the evaluation of the impact of the different factors of the model on the effectiveness of the mission, a tool for statistical development and analysis like JMP ® is used, which allows an Experimental Design process to be performed. Likewise, an evaluation module is developed to simulate, program and evaluate a set of experiments to determine the best effectiveness in the mission of interest.
Simulation factors
The aim is to analyze diff erent v ariables of the USV in the ASW, such as speed and sonar type. Also, some scenario factors correspond to simulation input parameters such as the type of search pattern, the search entry point, the search direction and the number of USVs. These are described individually below.
USV speed
Speed has a direct relationship with the autonomy of the USV; greater speed produces more fuel consumption, causing the decrease of hours that the USV can be maintained in the area of operation executing the mission. On the other hand, the speed directly impacts the detection range of the TAS sonar; which means that as speed increases, the amount of radiated noise produced by the propulsion system and other components significantly impacts the threat detection range.
The goal is to analyze, through the variation of this factor, the incidence in the reduction of the detection time of the threat and to determine if the autonomy is enough to culminate the exploration in an area. With the speed variation, it will be possible to analyze the behavior of the sonar detection range and the impact it generates on the autonomy of the USVs when performing the ASW mission.
Sonar type
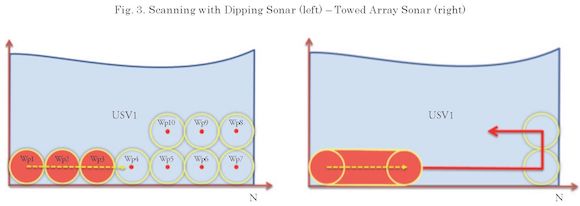
Two possible sonar types are implemented in the experiments, Dipping Sonar (DpS) or Dive Sonar and Towed Array Sonar (TAS) or Trailing Array Sonar. The main difference is in the way the threat is searched; while with the DpS maneuvers must be performed to advance, stop at a point, submerge the sonar, perform the search and raise the sonar again before advancing, with the TAS the search can be performed from the first moment the sonar is launched at a defined depth, which means continuously, see Fig. 3. On the left side of this image the different unfilled discs can be seen, where the USV must submerge the DpS. Each circle symbolizes the range of detection that sonar can achieve; the filled areas symbolize the scan performed. On the other hand, the right side of this image shows the continuous thin line that symbolizes the unexpanded trajectory of the USV, while the filled area displays the area that has already been continuously scanned using the TAS sonar. A threat can only be detected at the last exploration point of the trajectory.
In accordance with [8], the value of the Sonar Range of the results obtained in this research project are taken, thus reducing the complexity of the model and the development of sonar theory.
The objective is to analyze the behavior of the search for the threat and to observe the variation of effectiveness using these two types of sonars.
Number of USVs
Due to the size of the scanning area, the difference of using one or two USVs to perform ASW missions is analyzed, showing the contrast of the
detection time and the total effectiveness for the development of the mission.
Submarine Search Patterns
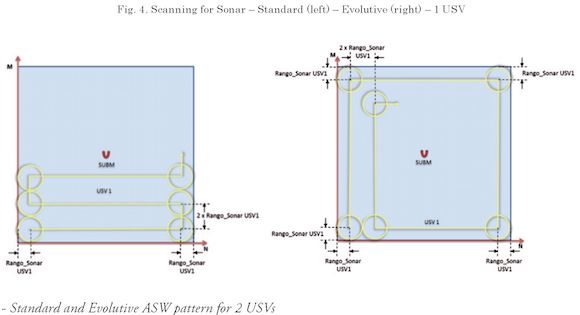
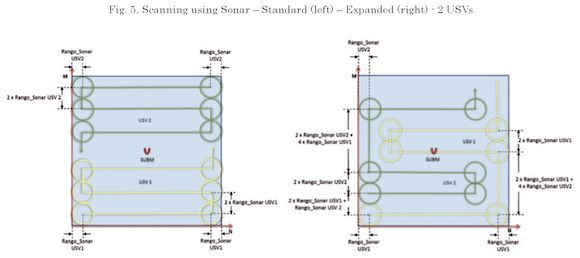
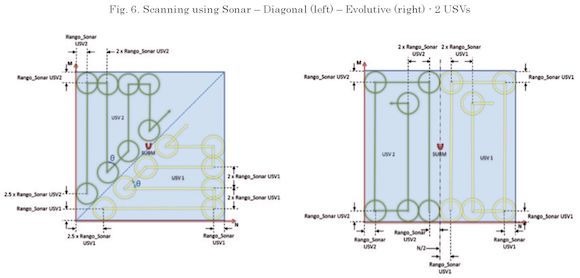
Based on the operational requirement to search for a threat in an area, four patterns are established adapted from different sources for the search of the submarine according to the OPSIT1 operational scenario. Standard, Diagonal, Expansive, and Evolutive are movement patterns implemented for one or two USVs looking at a specified area of NxM nautical miles, adapted from worldwide fleet procedures for search and rescue; the US Coast Guard and for submarine search in an area taken from NATO, documents of the Antisubmarine War of the Colombian Navy [11], [12] and other reviewed documents that due to their publication restrictions are not named in this document. Each of the different patterns implemented are listed below; each circle symbolizes the detection area ofeach USV.
- Standard and Evolutive ASW pattern for 1 USV
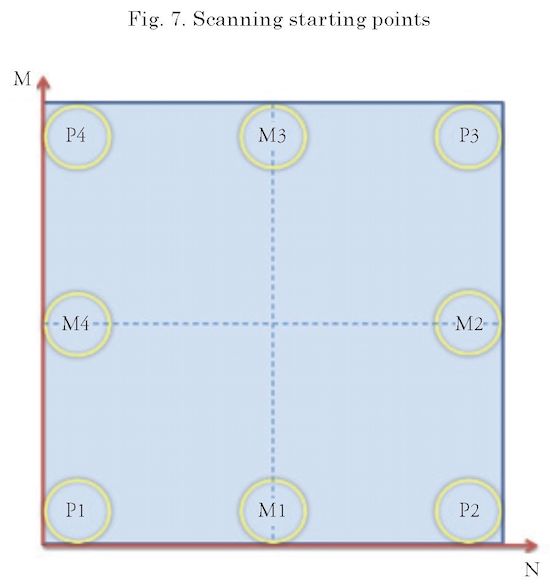
For a NxM area there are different start points according to the executed pattern. For the vertices of the area, the starting points P1, P2, P3 and P4 are defined. For the middle sections of each side of the area the points M1, M2, M3, M4 are defined. See Fig. 7.
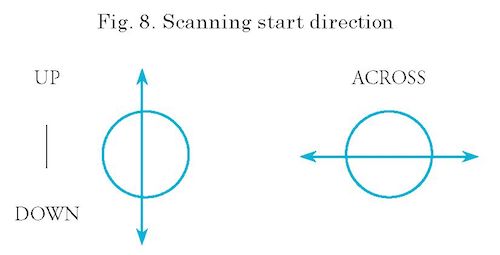
- Direction of the search starting point
To perform the exploration of the area the initial directions of exploration are defined, with Vertical and Horizontal as the options. See Fig. 8.
Response of the models
According to the operational scenario, two measures of performance (MOP - Measures of Performance) are established to determine the success of the mission; the time to detect the submarine and the detection of the submarine in the search area.
- MOP1 = Time to detect the submarine.
- MOP2 = Detection of the submarine in the search area
The mission's measure of eff ectiveness (MOE) will be defined by the weighted sum of the established MOPs, where the simulation response will finally be.

In accordance with the objectives of the mission, the following weights have been defined for
performance measures: w1 = 0.4, w2 = 0.6, values assigned by the operational advisors in the development of this research.
Development of models
For the generation of the different simulation algorithms of the patterns, different considerations are taken into account such as maintaining the same scenario as well as the characteristics of the USVs, and to define a random pattern of movement for the submarine, which means to initiate the simulation by locating the submarine at a random position within the area, random course and previously defined constant velocity.
Each algorithm implemented in Matlab1, simulates the movement of the USVs according to each pattern, defining the initial position for scanning the area and the course necessary to execute the first route. The pattern is continued and the calculated data is evaluated with each advance in time. The simulation ends in three ways: if the submarine enters the optimal sonar detection range of one of the USVs, if the distance between the two USVs is less than 1 Mile, which means that the whole area was scanned without finding the submarine; valid for Standard, or finally if the USVs end the scanning by leaving the scanning area; Valid for Expanded and Diagonal patterns. In the case of the Evolutive pattern, it ends when the circle has completely closed, which means that the area was already explored and there was no detection.
Seven (7) .m (Matlab) files are generated which simulate the movement of the USVs and the submarine for a total of approximately nine thousand nine hundred (9,900) lines of written code, which also allow each one of the factors named in previous subsections to vary.
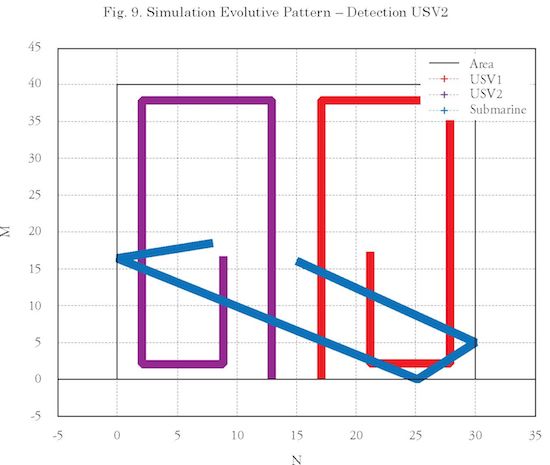
Fig. 9, displays the exploration area with two USVs (USV1 in magenta and USV 2 in red), performing an Evolutive pattern. Also it is possible to appreciate the trajectory of the submarine (in blue) that is finally detected by the USV1. From this simulation, the time spent by the USV1 is obtained and who detected the submarine. In the event of no detection, the total scanning time of the area is obtained, which means when the two USVs have completed the search within the area.
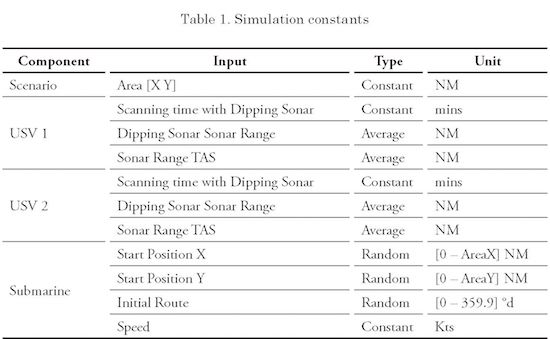
Simulation constraints and restrictions
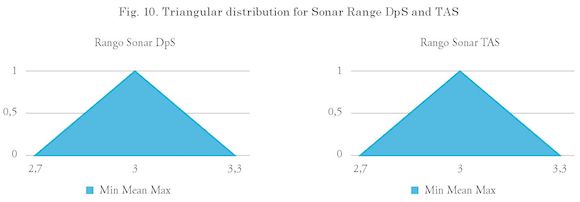
The parameters that will be present in all the simulation scenarios are defined, which include the constant and random values, see Table 1. For the Dipping Sonar and TAS range inputs, these are values that depend on several factors such as the physical and technical characteristics of the Sonar equipment, the operating environment, the type of target to detect, in addition to others; which means that they are not constant values. The constant value for this input is established by evaluating a triangular probabilistic distribution.
This distribution has the average detection range of the Dipping Sonar and TAS respectively as an input taken from [8]2, and it is evaluated +/- 10% for minimum and maximum values, see Fig. 10. It should be clarified that due to the level of the abstraction with which this model was created, it does not include the detection of the threat using physical formulas that represent the principle of detection.
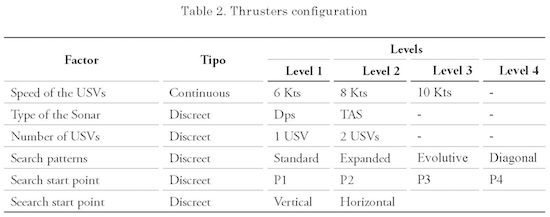
Taking into account the different levels for each factor in the simulation represented in Table 2, there are factors that present restrictions when they are related to another factor, preventing them from being simulated.
For the USV velocity, the restriction exists only for high scanning speeds, which determines a significant impact on the variation of the detection range and the autonomy of the USV. Also for the type of sonar, a physical model that determines a theory developed for the detection of the submarine is not established within the simulation, which means that a submarine is detected as long as it
is within the optimal range of the sonar on board the USV.
Referring to search patterns and the number of USVs in use, new restrictions arise. Each pattern establishes a minimum number of vehicles in the area due to its search principle, which means that to conduct coordinated search patterns, such as Expanded or Diagonal patterns, it is necessary to have at least two USVs.
Model variability
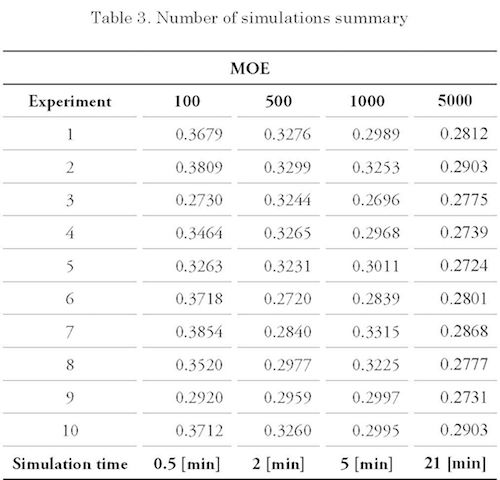
A variability of the model smaller than 1% is established taking into account the compensation between the variation of the MOE response and an acceptable time for the total of the simulations. Different experiments were carried out under an operating point in order to determine the maximum number of repetitions for this model, obtaining results of between 30 seconds and 21 minutes approximately for 100 and 5000 repetitions respectively, representing a relatively low computational cost.
In order to show the variability in the MOE obtained for this point of operation, ten independent simulations were performed for 100, 500, 1000 and 5000 repetitions. Based on these data, they were statistically analyzed, concluding that the number of 5000 simulations was used as the number of simulations, because it does not require a large amount computational resources and offers a standard deviation of less than 1%, providing greater reliability in the simulation results of the model.
Methodology
Different sensitivity analyzes are performed for each of the restrictions described above, using a common operating point and varying the different levels of each factor. These analyzes are performed in order to determine how much the MOE increases or decreases and will serve as a support to determine the most effective operating point. Due to the number of USVs used for the scan, the starting points of the search and the initial direction of the search are not main study variables, and the details from each of these factors are not shown.
- The use of two (2) USVs in the search shows a 20% increase in effectiveness compared to a single USV.
- The scanning starting point that leads to a better effectiveness of the mission differs with respect to the search pattern. P2 and M1 are the most effective for the different patterns.
- The initial direction of the search also differs with respect to the search pattern. For the "Down" start direction a better effectivity performance is observed.
Once the different constraints of the models are identified and analyzed, an experiment design (DOE) is formulated to establish the factors that will influence effectiveness; search patterns, sonar type, and velocity of the USVs, evaluating the impact of each of the variables in achieving the ASW mission.
The DOE is developed taking into account the following parameters:
- For the answers the Probability of detection of the submarines (Pd Sub) is used and also the time to detect a submarine (TD Sub)
- Patterns are used for the factors as a categorical variable for four levels (4) using Standard, Expanded, Evolutive and Diagonal patterns as values, and the Sonar Type for USV1 and USV2 is also used that corresponds to a categorical variable of two levels for towed (TAS) and variable depth (DpS) sonars. Lastly the speed that is taken as continuous variable from 6 kts to 10 kts.
For the development of the DOE and the subsequent analysis, a computational tool called JMP ® is used, which offers graphical and numerical tools that allows the variability of the model to be defined with changes in the input factors, and to obser ve the impact on the effectiveness in the different simulations. The result of the DOE is the construction of a table with twent y (20) experiments to be developed to later ana lyze the behavior of each of the responses in relation to the model factors.
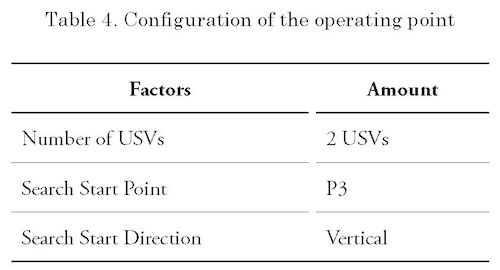
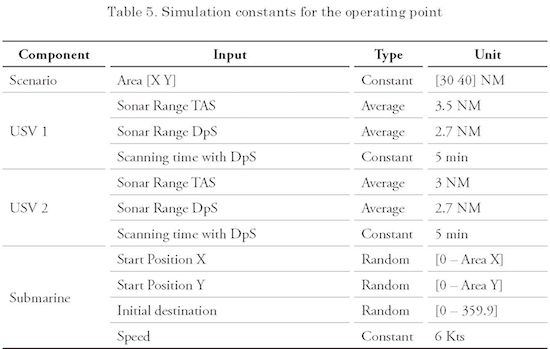
In order to continue with the fina l experiments, the configuration seen in Table 4 a nd Table 5 of the other parameters of the model is determined using a random point of operation for the variables that have already been reviewed in the previously presented sensitivity analy zes.
Results
A fter simulating the model for different combinations of sensors, patterns a nd velocity for both USVs, the re su lt s a re entered into the JMP tool where a least squa res regression model is implemented in order to ana lyze t he behavior of the model outputs. The Ef fect Screening of the JMP tool is a lso used to guide the determination of which effects are signif icant in the model.
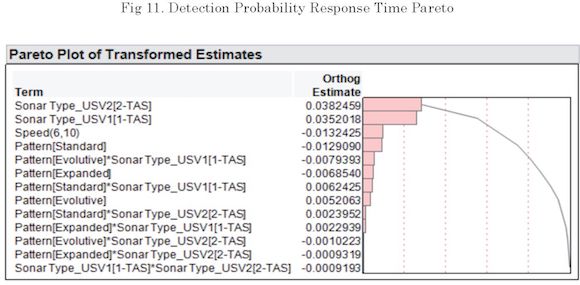
In the probabilit y of detection response that the factors with the most influence on the response are sonar t ype TAS for the USV1 and USV2. In particular, the sonar type infers more than 20% in the variation of this response a nd another variable is not identified that has a strong influence on this response through the Pareto graph. See Fig. 11.
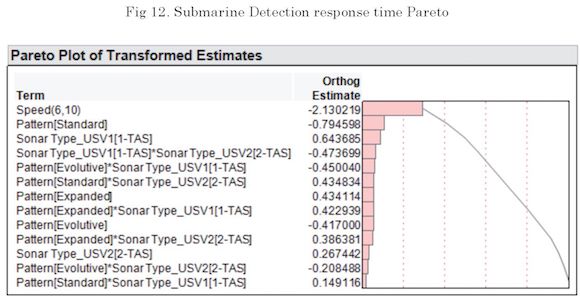
Continuing with the Submarine Detection Time response, it is observed in Fig. 12 that the only factor influencing the variation is speed, with approximately 30%. According to the Pareto graph response, the other factors influence the variability of the detection time of the submarine.
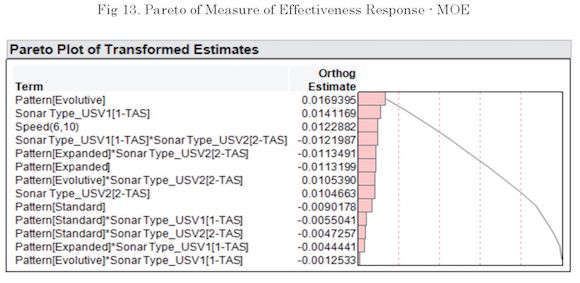
Finally we analyze the measure of effectiveness -MOE, which brings together the first two answers in a single metric. It is analyzed by the Pareto graph, in Fig. 13, where it is evidenced that there is no factor that dominates the variability of the model, nevertheless the evolutionary search pattern, the use of TAS sonars and the speed of exploration, are the most influential variables in increasing effectiveness. On the other hand, the Expanded and Standard search pattern have slightly less influence on the output of the model and can be analyzed later with a different analysis. An important detail in the graph is the relationship between the sonar type and the search pattern, representing a minor variation but that should be considered in a more detailed analysis.
Finally we analyze the measure of effectiveness -MOE, which brings together the first two answers in a single metric. It is analyzed by the Pareto graph, in Fig. 13, where it is evidenced that there is no factor that dominates the variability of the model, nevertheless the evolutionary search pattern, the use of TAS sonars and the speed of exploration, are the most influential variables in increasing effectiveness. On the other hand, the Expanded and Standard search pattern have slightly less influence on the output of the model and can be analyzed later with a different analysis. An important detail in the graph is the relationship between the sonar type and the search pattern, representing a minor variation but that should be considered in a more detailed analysis.
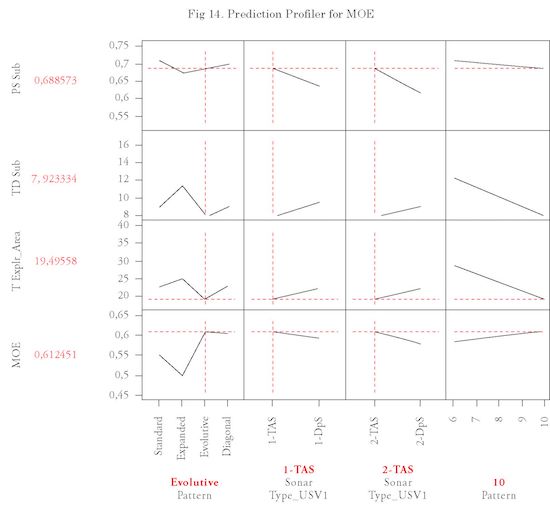
These graphs allow a quick identification of the most important factors. However, given the relationship between the different inputs and outputs, in the Prediction Profiler graph of the JMP® tool it can be seen how the selection of each factor influences each one of the model responses. See Fig. 14.
Analyzing in detail the sonar type, it is observed in the graph that the use of Dipping Sonar (DpS), does not generate any positive contribution in the effectiveness. This can happen due to the time that the USV must remain stationary while doing the scanning. In addition the DpS also has less reach than the TAS sonar.
Fig. 14 shows a clear picture of the comparison of the model factors and the measure of effectiveness, with Evolutive as the best search pattern, TAS as the best type of sonar and observing the behavior of the speed that significantly improves MOE up to a maximum value of 10 kts.
Conclusions
The best configurations were obtained for the different factors that affect the ASW using USVs, with the best result being the use of two unmanned vehicles to search for a threat in an area near the coast. It was also determined that the best effectiveness is achieved using a search pattern such as the Evolutive pattern, a towed TAS type sonar and to operate at the maximum possible speed, without degrading sonar performance; 10 Kts was used for the development of this thesis.
It was determined that performing the search using DpS immersion sonar is less effective than using a towed sonar TAS. This can be due to the way the DpS sonar operates, since the scan is not continuous and it is required to move to different points in the area to perform the search. Also, stopping at a certain time in each scanning point considerably a ffects the threat detection time.
Carrying out different sensitivity analyzes allows the independent evaluation of each factor in the model to be obtained, simplifying the process by not having to analyze multiple variables of the final result.
Performing the design of experiments with the JMP ® tool allows the complexity of determining the different experiments to be carried out to be reduced. It also allows the number of tests to be optimized, with less time used in the simulation of each simulation condition and fewer computational resources being needed.
On the other hand, adopting the developed evaluation methodology allowed the analysis of the answers to be simplified and by means of complementary analyzes it was possible to verify and detail the results of each simulation.
Thanks
Special thanks to the Naval Captain (R A) Gustavo Pérez and the Commander José M. Gómez, for their continuous support and for sharing all their knowledge, both methodological and operational, which supported this paper.
1 Interactive environment and high level language for numerical calculation, visualization and programming. [13].2 Results of research carried out at COTECM AR to deter mine the best combination of weapons and sensors to be installed in the future Strategic Surface Platforms - SSP of the ARC.
Bibliography
[1] The National Academies Press, Autonomous Vehicle in Support of Naval Operations, Washington, USA: The National Academy of Sciences, 2005.
[2] Real Academia Española, «DICCIONARIO DE LA LENGUA ESPAÑOLA - Vigésima segunda edición,» 2011. [En línea]. Available: http://lema.rae.es/drae/?val=s%F3nar. [Último acceso: Marzo 2013].
[3] General Dynamics News, «General Dynamics Robotic Systems Awarded $13 million USV Contract,» Octubre 2006. [En línea]. Available: http://www.generaldynamics.com/news/press-releases/detail.cfm?customel_ dataPageID_1811=8012. [Último acceso: Marzao 2013].
[4] THALES, FLASH on USV & Surface Ship, Francia: Thales - Underwater Systems, Mayo 2013.
[5] B. BRADLEY Y H. CHRISTOPHER F., «Development of the Anti-Submarine Warfare Unmanned Surface Vehicle (ASW USV). Engineering Developmental Model to Meet US Navy Needs,» General Dynamics Robotic Systems, Westminster, USA, 2010.
[6] A. M. S. Authority, Manual, National Search & Rescue, Canberra: Australian Maritime Safety Authority (AMSA) on behalf of the Australian National Search and Rescue Council, 2014.
[7] J. M. GÓMEZ T., «WARSHIP COMBAT SYSTEM SELECTION METHODOLOGY BASED ON DISCRETE EVENT SIMULATION,» Naval Postgraduate School, Monterey, California, 2010.
[8] G. PÉREZ, J. GÓMEZ, S. MARRUGO y V. DÍAZ, «DESARROLLO DE MODELOS COMPUTACIONALES PAR A OPTIMIZAR LA EFECTIVIDAD DE LA PES EN LA GUERRA ANTISUBMARINA, ANTIAÉREA Y DE SUPERFICIE,» COTECMAR, Cartagena, Colombia, 2012.
[9] IHS Jane's, Submarine Type 212A, Alemania: Janes's Fighting Ships, 2013.
[10] Jnes's, «Jane's Unmanned Maritime Vehicles and Systems,» Naval Undersea Warfare Centre - General Dynamics Robotics Systems, 16 04 2009. [En línea]. Available: https://janes.ihs.com/CustomPages/Janes/DisplayPage.aspx?DocType=Reference&ItemId=+++1323808&Pubabbrev=JUMV. [Último acceso: Noviembre 2013] .
[11] H. TN CALDERON SALAZAR, Guerra Antisubmarina, Cartagena, Colombia: Fuerzas Armadas de Colombia, Armada Nacional, Escuela Naval de Cadetes "Almirante Padilla", Departamento de Operaciones.
[12] M. CCESP GUILLEM MONROY y N. CCESP TRONCOSO NIEVES, Táctica II - Guerra Antisubmarina, Cartagena, Colombia: Fuerzas Armadas de Colombia -Armada Nacional - Escuela Naval de Cadetes "Almirante Padilla".
[13] Mathworks, «MATLAB,» 2014. [En línea]. Available: http://www.mathworks.com/products/matlab/. [Último acceso: Enero 2014] .