Diana S. Hurtado Bustos1, Rubén J. Paredes Alvarado2
In the present study, numerical resistance predictions using OpenFOAM were performed considering the Cormorant Evolution Catamaran, which provides travel services in the Galapagos Islands. These predictions were compared with experimental data published by Chávez and Lucín [1] and with systematic series [2]. Simulations were made at model scale of 2 [m] in two load conditions, considering demi and twin hull (s=0.56 [m]) configurations. A mesh convergence study was performed with 3 different meshes for V=1.05 [m/s] at Light Condition (T=0.086 [m]). The converged mesh, with 1 million of cells approximately, has the lower standard deviation and a 5% error when compared to its experimental value of 1.79 [N]. The errors between the experimental data and the numerical simulations for demi hull configuration were 43% and 36% for Light and Full conditions, respectively. Besides, for twin hull configuration the errors were around 14% and 32% for Light and Full conditions, respectively.
Key words: Catamaran, CFD, resistance, interference.
En el presente estudio, predicciones numéricas de resistencia usando OpenFOAM fueron realizadas considerando el Catamarán “Cormorant Evolution”, que ofrece servicios turísticos en las Islas Galápagos. Las predicciones numéricas fueron comparadas con datos experimentales publicados por Chávez y Lucín [1], y con métodos estadísticos [2]. Las simulaciones fueron realizadas con un modelo de 2[m] en dos condiciones de carga, considerando uno y los dos cascos (s=0.56 [m]). Se realizó un estudio de convergencia con tres mallas para V=1.05 [m/s] en condición ligera (T=0.086 [m]). La malla seleccionada contiene alrededor de 1 millón de celdas y presenta un error del 5% frente a una resistencia experimental de 1.79 [N]. El promedio de los errores entre datos experimentales y simulaciones numéricas para un casco son del 43% y 36% para condición ligera y cargada, respectivamente. Por otro lado, los errores para dos cascos son del 14% y 32% para condición ligera y cargada, respectivamente.
Palabras claves: Catamarán, CFD, resistencia, interferencia.
CFD Computational Fluid Dynamics
Exp Experimental
OF OpenFoam
RANS Reynolds Average Navier-Stokes
Rt Total Resistance in Newtons [N]
S Separation distance between the hulls (m). Sta. Dev. Standard Deviation
T Model draft (m)
V Velocity of the simulation fluid (m/s)
The resistance of a ship at a given speed is the force required to tow the ship at that speed in calm water, assuming no interference from the towing ship [3]. The ship must provide the minimum shaft horsepower to cruise at required velocity.
Ship resistance estimation is a complex task. It can be broken down into frictional and residual components. In addition, there is an additional component in the case of catamarans, such as the interference between the demi-hulls. There are three different methods to predict ship resistance: empirical methods, model testing and numerical simulations.
In the last years, numerical simulations using CFD have become a third alternative used in the industry. The CFD solution is a numerical method to solve the nonlinear differential equations governing the fluid flow. However, it cannot be used as a black box because it can produce spurious results if not set correctly. It is required to perform a verification and validation procedure, usually using experimental data.
In this work, numerical simulations were performed to predict total resistance of a catamaran and results were validated using experimental data obtained by Chávez and Lucín [1]. OpenFOAM is used to predict the catamaran resistance. It was chosen because of its customization options, online training and support, and it is open source.
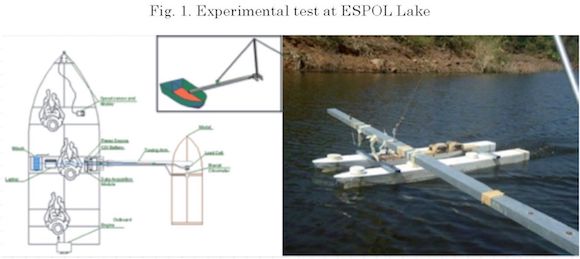
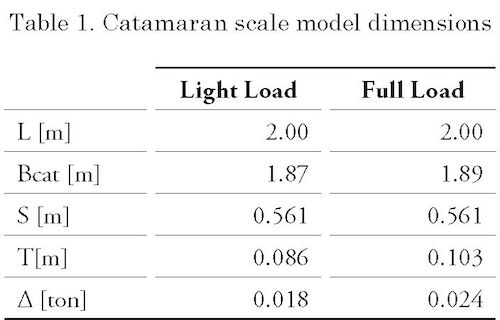
The “Cormorant Evolution” Catamaran was built in Ecuador in 2011 by “Astilleros y Marina BOTTO CIA. LTDA”, and operates through “Cormorant Cruise” in Galapagos Islands [4]. It is a 32.5 [m] length fiberglass touristic vessel; with a “V” middle section, a bulbous bow, separation of 9.11[m] between the centerlines of hulls and a design velocity of 5.14 meters per second (10 knots). Subsequently a 2 [m] length model was built using Cormorant Evolution hull-shape, to measure experimental resistance in the lake of “Escuela Superior Politécnica del Litoral” (ESPOL) [1]. The scale factor was 2=16.25- The experiment velocity range of the model was from 1.05 to 1.45 meter per second. Table 1 shows the main characteristics of the catamaran at two load conditions.
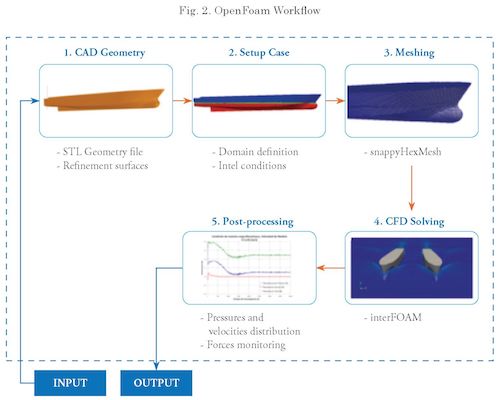
Open Source Field Operation and Manipulation (OpenFOAM) is a free source code with C++ programing language. This code creates executable
scripts, called applications that are divided in two categories: solvers developed for specific problems in continuum mechanics, and utilities developed to manipulate data. Fig. 2 shows the workflow of OpenFOAM.
There are three physical laws that govern a fluid flow: Conservation of Mass, Conservation of momentum, and Newton's Second Law. However, these equations cannot be solved analytically for all types of problems.
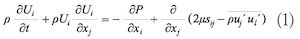
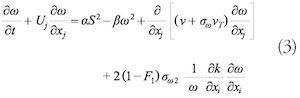
One alternative is to solve them numerically using Computational Fluid Dynamics (CFD). In real applications, fluids flow is turbulent and it can be modeled by R ANS technique. The governing equations are:
Reynolds Average Navier-Stokes
For linear eddy viscosity models, R ANS need some extra terms (transport properties) to represent the turbulence properties of the flows. In this work turbulence is modeled using the k-Omega SST method, which is a two-equation linear eddy-viscosity model.
Turbulence kinetic energy
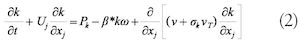
Specific dissipation rate
The following assumptions about the numerical model to be implemented are considered:
For marine applications, two solvers can be used for multiphase flows, interFoam and interDyFoam. In this thesis, the InterFoam solver is applied because only ship resistances are measured in experiments. InterFoam is a solver for two incompressible, isothermal immiscible fluids using a volume of fluid phase-fraction based interface capturing approach [8]. The computational domain includes fresh water and atmosphere.
y+ is the non dimensional distance and OpenFOAM is a post processing tool applied to near-wall cells of all wall patches. The value obtained by y+ can describe the places where the mesh has to have a greater number of cells. y+ is defined by:
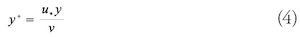
Where u* is the frictional velocity at the nearest wall, y is the distance to the nearest wall and v is the local kinematic viscosity of the fluid.
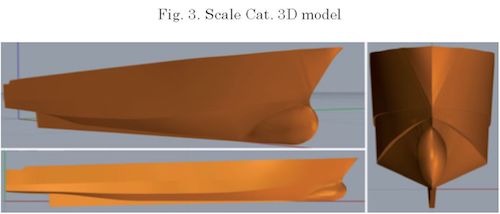
The 3D surface model was generated with the body and profile plan in the Computer Aided
Design (CAD) software Rhinoceros 3D [5] and positioned after the perpendicular line at the origin axes before exporting as a STL file to import into the CFD code, OpenFOAM. Fig. 3 shows the 3D R hinoceros scaled demi-hull model.
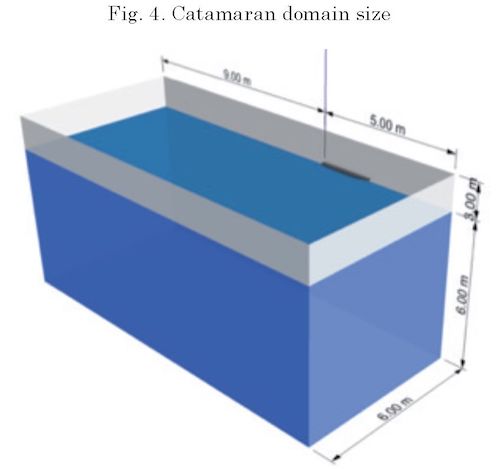
The computational domain was built as a rectangular block around the hull (demi and twin hulls) in deep water; Fig. 4 shows the principal dimensions in meters.
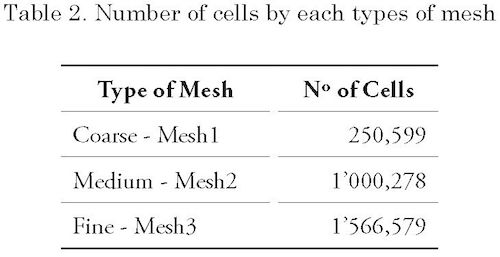
To identify the mesh density needed for the Catamaran cases a mesh convergence study was perform. The domain was divided into six blocks with different mesh densities. Table 2 shows the number of cells for each mesh.
To visualize the convergence of the simulations, Fig. 5 shows the force time history (4,000
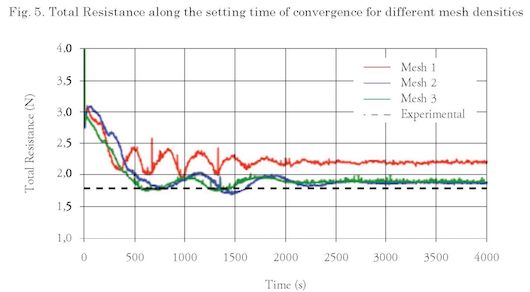
seconds — Fixed time step 1 per second) for each mesh.
Four thousand values of resistance were generated at the Light Load condition at v=1.05 [m/s]. Table 3 shows the average of the last five hundred values for the resistance of each mesh and its error when compared with an experimental value of Rtexp=1.79 [N].
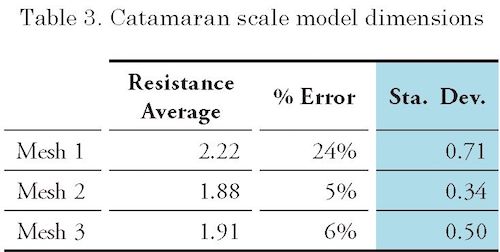
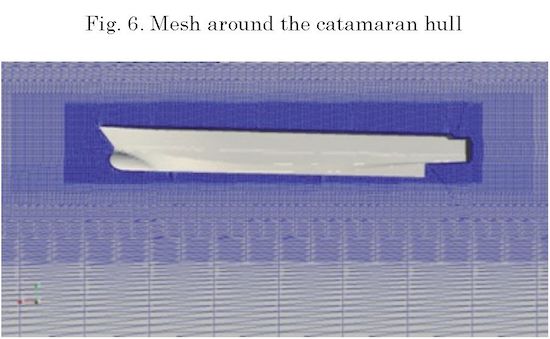
The errors between meshes 2 and 3 are closer. But, analyzing the standard deviation, Mesh 2 has less variation of resistance in the analyzed steps. Mesh 2 was selected to set up the other simulations. Fig. 6 represent the mesh 2 configuration around the hull.
As a post-processing tool, y+, was calculated to verify the mesh quality near the hull. A value of y+ <100 is acceptable for the case of the catamaran. Fig. 7 shows the wall y+ parameter for the submerged hull.
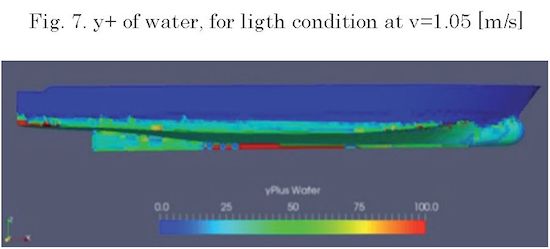
Bow, Stern and central keel are zones that required a grater mesh density.
OpenFOAM calculate the forces components acting in Catamaran hull, namely pressure and
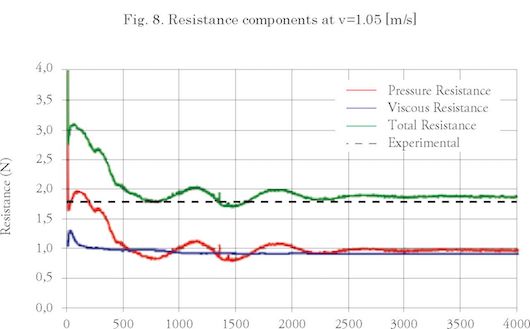
viscous. Fig. 8 shows Pressure and Viscous force components for the case of demi-hull in Light Condition at a velocity of V=1.05 [m/s]. The experimental resistance is 1.79 [N] at Fn=0.2453.
Total resistance was obtained by adding pressure and viscous forces.
The model was simulated following the experimental data [1], and compared with Maxsurf-Resistance. For demi hull Maxsurf-Resistance case, Holtrop method was used.
Table 4 and 5 present the data obtained by OpenFOAM simulations at different velocities in two Load Conditions. The percentage of standard deviation was obtained by [1]:
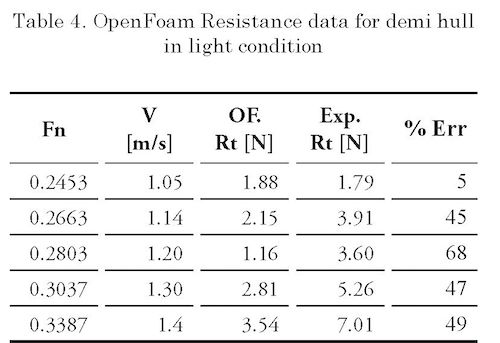
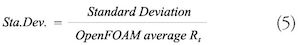
Figs. 9 and 10 shows the total resistance by OpenFOA M, experimental data and Maxsurf for demi hull. The simulation standard deviation it's about 0.63%, due this cannot be displayed.
The model was simulated following the experimental data [1], and compared with Maxsurf-Resistance. To simulate the catamaran structure in OpenFOAM, the hull was displaced into the computational domain a distance S=0.2805 [m], measured from the centerline of ship to centerline of the hull, Fig. 11 shows the distribution.
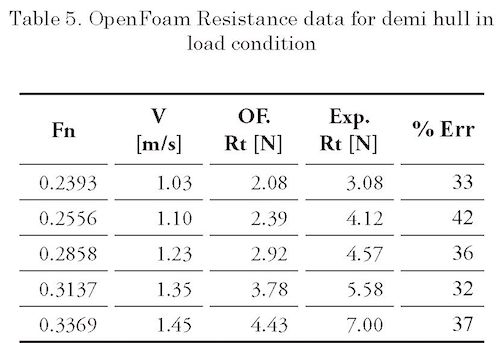
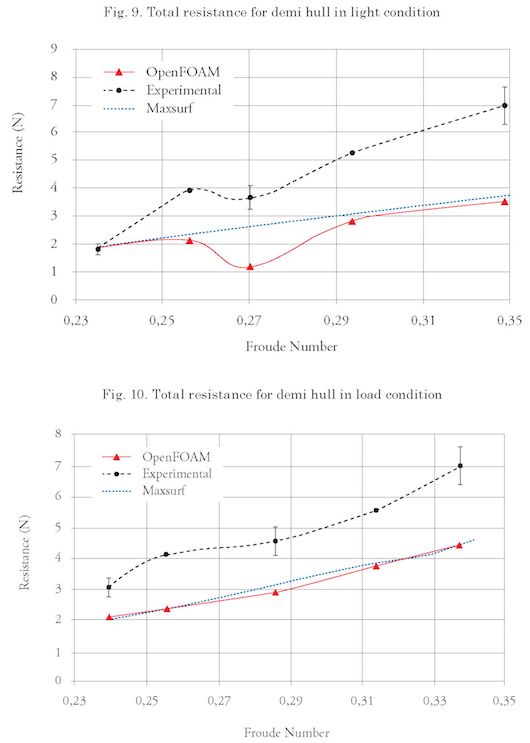
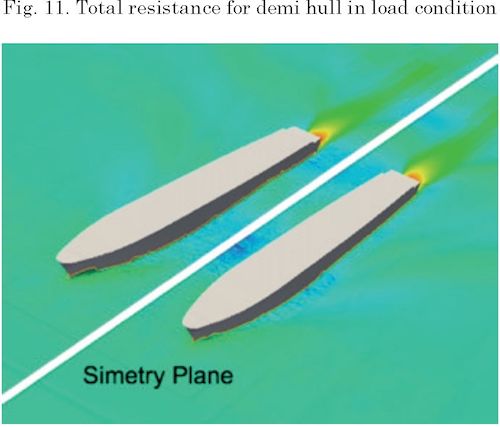
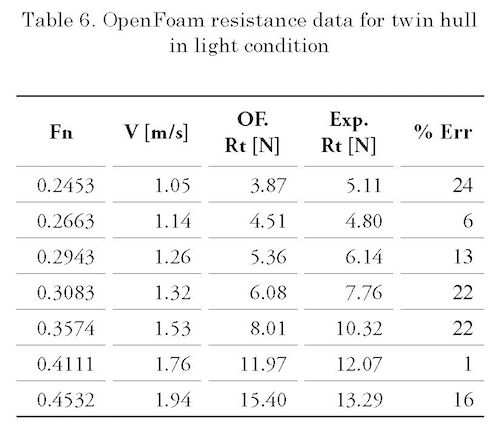
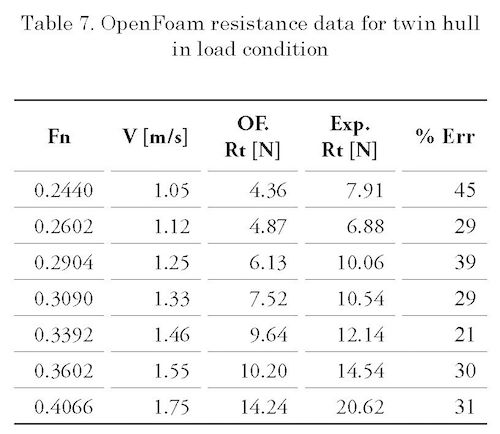
Table 6 and 7 present the data obtained by OpenFOAM simulations at different velocities in two Load Conditions.
Figs. 12 and 13 shows the total resistance by OpenFOAM, experimental data and Maxsurf for demi hull.
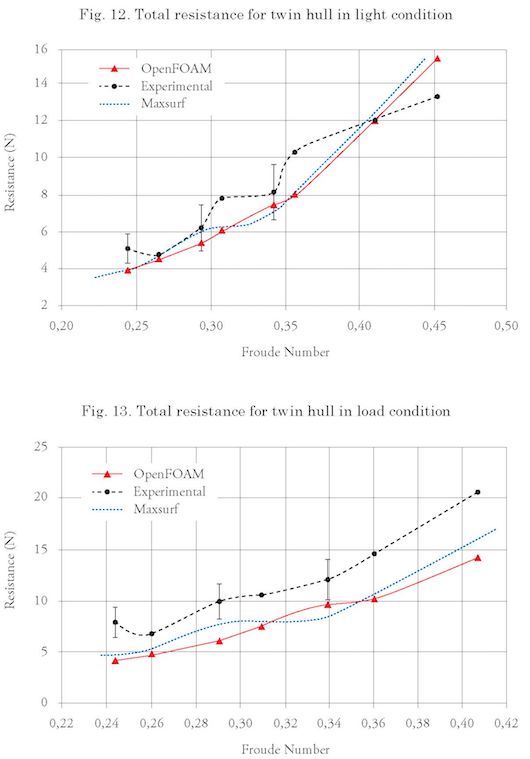
The errors between experimental data and numerical simulations are lower in light condition of catamaran. However none of the curves follows the same trend.
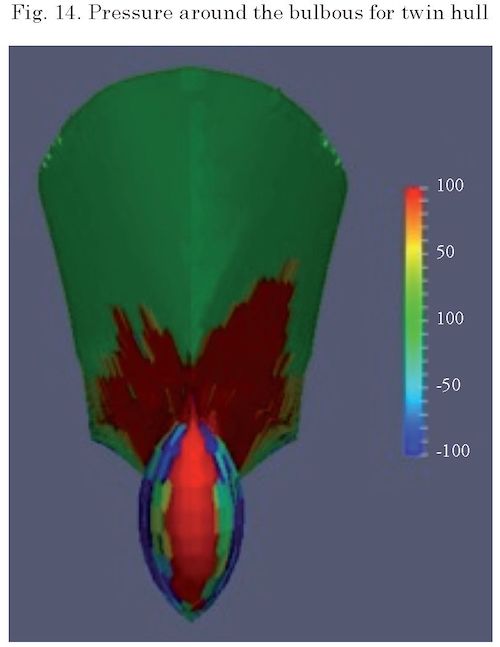
Fig. 14 shows the pressure distribution the hull for Fn=0.34 (v=1.45 m/s). The labels of dynamic pressure was setting to capture as blue ones the zones with negative pressure and red ones the zones with positive pressure. For twin hulls, the pressure in the inner side of the hull is slightly greater than the pressure on the outside of the hull; this is due to the interference caused by the other hull.
The catamaran interference was estimated following the expression [1]:
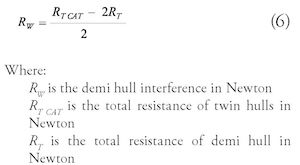
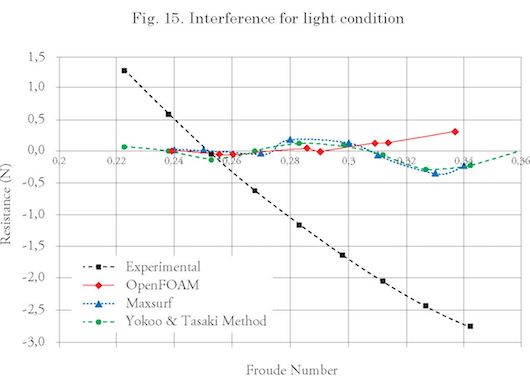
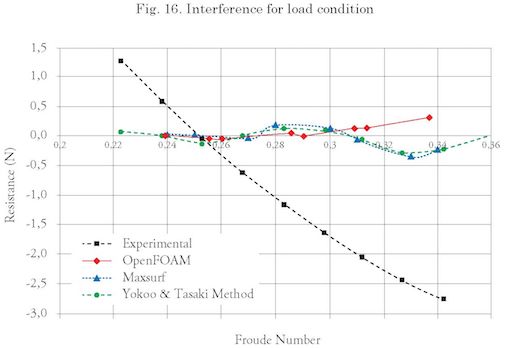
Figs. 15 and 16 shows the interference factor for original hull separation at Light and Full load conditions.
The interference factor obtained by numerical simulations is linear contrasting with the experimental interference published by Chávez and Lucín [1]. The positive interference corresponds to increased interference (unfavorable) and the negative values to decrease (favorable).
Figs. 17 to 19 shows the wave pattern for different Froude numbers in Full load condition.
The blue areas correspond to the hollow of the wave and the red areas to the hump. Of these three
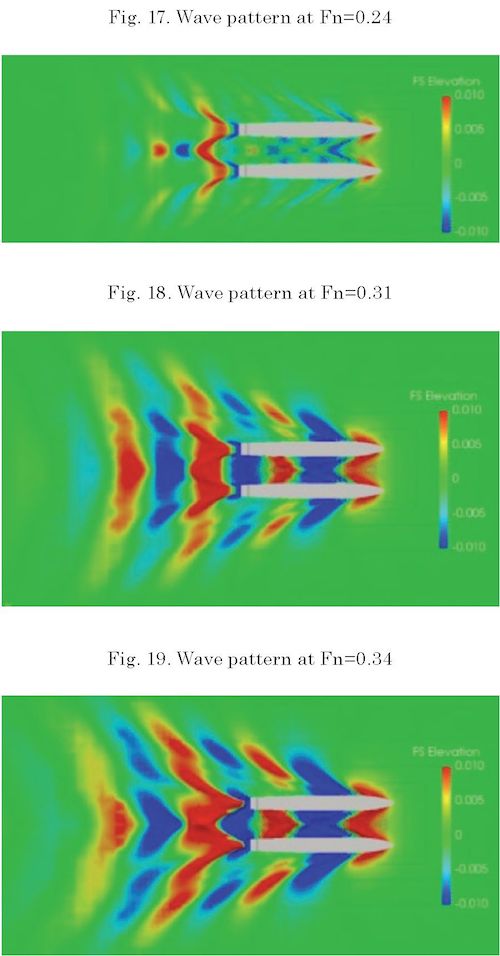
figures it is emphasized that as the speed of the simulation increases the amplitude and the length of the wave increase. Also, the wakes pattern from the lowest to the highest velocity produce the increase in zone of interference.
Before starting the Catamaran numerical resistance, several tutorials were carried out using the OpenFOAM user manual [6]. These tutorials were of great help to understand the capabilities and limitations of the software. Cavity was the first made tutorial, for laminar and incompressible flows. The user manual gives an overview of the workflow of OpenFOAM: Pre-processing, solution and Post-processing. ParaView is a post-processing tool; the user manual also gives an introduction of its operation. This was an important step for understanding OpenFOAM and the principles of fluid analysis.
A catamaran mesh convergence study was developed first, with 3 types of mesh for a demi hull at Fn=0.2453. Mesh 2, with 1 million of cells, was chosen to the simulation because had the lowest error and standard deviation at Rtexp=1.79 [N], error=5% and Sta. Dev.=0.34 [N]. Due the extensive time of resolution, the interDyMFOAM solver was not taken into consideration in the Catamaran hull. Two load conditions were implemented for demi and twin hulls. The errors for Light Load Condition were: 42.8% in Demi Hull and 14.0% in Twin Hull configurations. The errors for Full Load Condition were: 36.0% in Demi Hull and 32.0% in Twin Hull configurations.
Numerical simulations using OpenFOA M are a feasible method for predicting the resistance of the Cormorant Evolution catamaran, despite the difference between experimental data and numerical simulation resistance. However, numerical results are close to statistical methods, such as Holtrop and Molland, estimated with Maxsurf Resistance software.
The interference component between the twin hulls was estimated for Full and light Load conditions for Fn between 0.24 and 0.34. But these results were not those expected, because the curves of interference did not display the same trend. Also, the interference factor was calculated using the Maxsurf data and even though it was not very close, the Maxsurf interference had the same trend compared to numerical data.
These variations between experimental results and numerical simulations may be due to external factors, that can not be controlled or measured, such as: wind, water temperature, interference between the method of drag, towing velocity uncertainly, differences between the model and the catamaran, and range of work of Data Card available in our college.
[1] LUCÍN A. & CHÁVEZ J. “Estudio experimental de la influencia de la separación de los cascos sobre la Resistencia en un catamarán de 32.5 metros”, 2012.
[2] HOLTROP J. & MENNEN G.G.J. “An approximate power prediction Method”, 1984.
[3] The Society of Naval Architects and Marine Engineers-SNA ME, Principles of Naval Architecture, December 1966.
[4] Astillero y Marina BOTTO CIA. LTDA., Memoria Técnica del Catamarán “Cormotant Evolution”, 2010.
[5] Rhinoceros, Rhinoceros 5 - 90 days trial, https://www.rhino3d.com/es
[6] OpenFoam, The Open Source CFD Toolbox User Guide, Version 3.0.1, 13th December 2015.
[7] YOKOO K. & TASAKI RYO, Technical Report No1: “On the twin hull ship” of the University of Michigan, 1951.
[8] BERTR AM V., Practical ship hydro dynamics, 2000.
[9] J. P. LAVAL. Unsteady Simulations on Turbulence Flows (DNS & LES), Laboratoire de Mécanique de Lille (LML), CNRS. France 2006.
[10] PETROS VOXAKIS, Ship Hull Resistance Calculations Using CFD Methos, Naval Engineer and Master of Science in Mechanical Engineering at the Massachusetts Institute of Technology. May 2012.
[11] MENTER, F.R., KUNTZ, M. AND LANGTRY, R. TEN Years of industrial experience with the SST turbulence model. Turbulence, Head and Mass Transfer 4. Edited by K. Hanjalic, Y. Nagano, and M. Tummers. New York. 2003.