Ship Science & Technology 10(20): 41-57, 2017
Onshore Reception Facilities for ballast water
Newton Narciso Pereira1, Hernani Luiz Brinati2, Rodrigo Pereira Antunes3
1 Department of Production Engineering, School of Industrial Engineering Metallurgical at Volta Redonda. Sao Paulo, Brazil. Email: newtonnaval@gmail.com
2 Department of Naval Architecture and Ocean Engineering - School of Engineering - University of Sao Paulo. Sao Paulo, Brazil.
3 Civil and Coastal Engineering Department - Engineering School of Sustainable Infrastructure & Environment - University of Florida (UF). Florida, USA.
Date Received: June 13th 2016 - Fecha de recepción: Junio 13 de 2016. Date Accepted: November 28th 2016 - Fecha de aceptación: Noviembre 28 de 2016
This paper completes an exploration analysis of onshore ballast water treatment alternatives at major ports. The authors had presented results for option (1) ballast water treatment onshore installed in two iron ore ports in 2012 applying the discrete events simulation model. Now, two more options are presented: (2) mobile and (3) desalination reception facilities. The previous simulation model developed called TRANSBALLAST, was adapted to consider these two new alternatives. This model was applied to the same ports presented in 2012 and this evaluation also includes one more port with 30 million tons annually (Mta) of iron ore transport capacity. The results uncovered that for (2) there is an increase of 1.90 days on the average waiting time of ships that moored at Port 1. In (3), the average waiting time and berth occupation rates were observed to remain the same presented in (1). One of the major differences between the systems consists in catching sea water to increase the desalination plant operational capacity. Among those three onshore ballast water treatment alternatives, (2) does not impact port terminals infrastructure. Additionally, option (2) could be offered to ports users as a ballast water treatment service and ship-owners might not need any onboard ballast water treatment system. (3) Might be feasible to ports regions without enough water supplies solving two issues: transfer of invasive species from ballast water and water recycling.
Key words: Port, Ballast Water Desalination, Barge, Onshore Water Treatment, Mobile, Shipping, Brazil, Fresh Water.
Instalaciones de Recepción en tierra para agua de lastre
Este ensayo realiza un análisis exploratorio de alternativas de tratamiento de agua de lastre en tierra en puertos principales. Los autores habían presentado resultados para la opción (1) del tratamiento en tierra de agua de lastre instalado en dos puertos de minerales de hierro en 2012 aplicando el modelo de simulación de eventos discretos. Ahora, se presentan dos opciones adicionales: (2) móvil e (3) instalaciones de recepción de desalinización. El modelo de simulación anterior desarrollado que se denominó TRANSBALLAST, fue adaptado para considerar estas dos nuevas alternativas. Este modelo fue aplicado a los mismos puertos presentados en 2012 y esta evaluación también incluye un puerto adicional de 50 millones de toneladas al año (Mta) de capacidad de transporte de minerales de hierro. Los resultados concluyeron que para (2) hay un aumento de 1.90 días de promedio de tiempo de espera de naves que atracaron en el Puerto 1. En (3), el tiempo de espera promedio y las tasas de ocupación de atraque fueron observadas para mantenerse igual que las presentadas en (1). Una de las principales diferencias entre los sistemas consiste en atrapar agua de mar para aumentar la capacidad operacional de la planta de desalinización. Entre esas tres alternativas de tratamiento de agua de lastre, (2) no tiene un impacto en la infraestructura de los terminales de puertos. Adicionalmente, la opción (2) puede ser ofrecida a usuarios de puertos como un servicio de tratamiento de agua de lastre y los propietarios de naves podrían no necesitar ningún sistema de tratamiento de agua de lastre a bordo. (3) Podría ser viable en regiones portuarias sin suficientes suministros de agua resolviendo dos problemas: la transferencia de especies invasivas del agua de lastre y reciclaje de agua.
Palabras claves: Puerto, Agua de Lastre, Desalinización, Barcaza, Tratamiento de Agua en Tierra, Móvil, Navieras, Brasil, Agua Dulce.
Ballast water impact has been widely discussed (Carlton and Geller, 1993) (Gollasch, 2006) (Minton, et al, 2005) (Hallegraeff, 1992) (David and Gollasch, 2014). Since 2004, the International Maritime Organization (IMO) has attempted implementing the International Convention for the Control and Management of Ships Ballast Water and Sediments - ICBWS IMO, 2004.
During the last 9 years a great effort has been dedicated to ratify ICBWS (Cohen and Dobbs, 2015) (David and Gollasch, 2014) however, there is a lack of member countries’ that agrees on this subject. Today, 44 countries representing a combined tonnage of 32.86% of the world merchant fleet have ratified the convention ICBWS (IMO). Seeking to meet ICBWS requirements, a number of systems of Ballast Water Treatment (BWT) have been developed over the last years (Jing et al, 2010). There are 53 certified treatment systems that could be installed on ships (Cohen and Dobbs, 2015). Moreover, (King et al, 2012) shows that there is a potential $50 to $70 billion market for BWT.
The United States is imposing a criteria that is 100 to 1,000 times more restrictive than IMO (Pereira and Brinati, 2012). Thus, with a worrying scenario for ship-owners and environmental managers, ratified BWT systems are being tested since 2011 (Dobroski, et al, 2011) (Albert et al. 2013) and none of them meet the criteria established by California and Michigan. On the other hand, tests on the equipment for the treatment of ballast water discharges need transparence and better science to avoid bad choices by shipowners (Cohen, 2015).
The lack of solution onboard ships increases the need for new studies into Ballast Water Treatment Onshore (BTWO) . Hence, this study presents an extension to the exploration study into BWTO at major ports. (Pereira and Brinati, 2012) presented results for option (1) Ballast Water Treatment Onshore installed in 3 Brazilian iron ore ports. Now, two new options are presented: (2) Mobile and (3) Desalination Receptions Facilities.
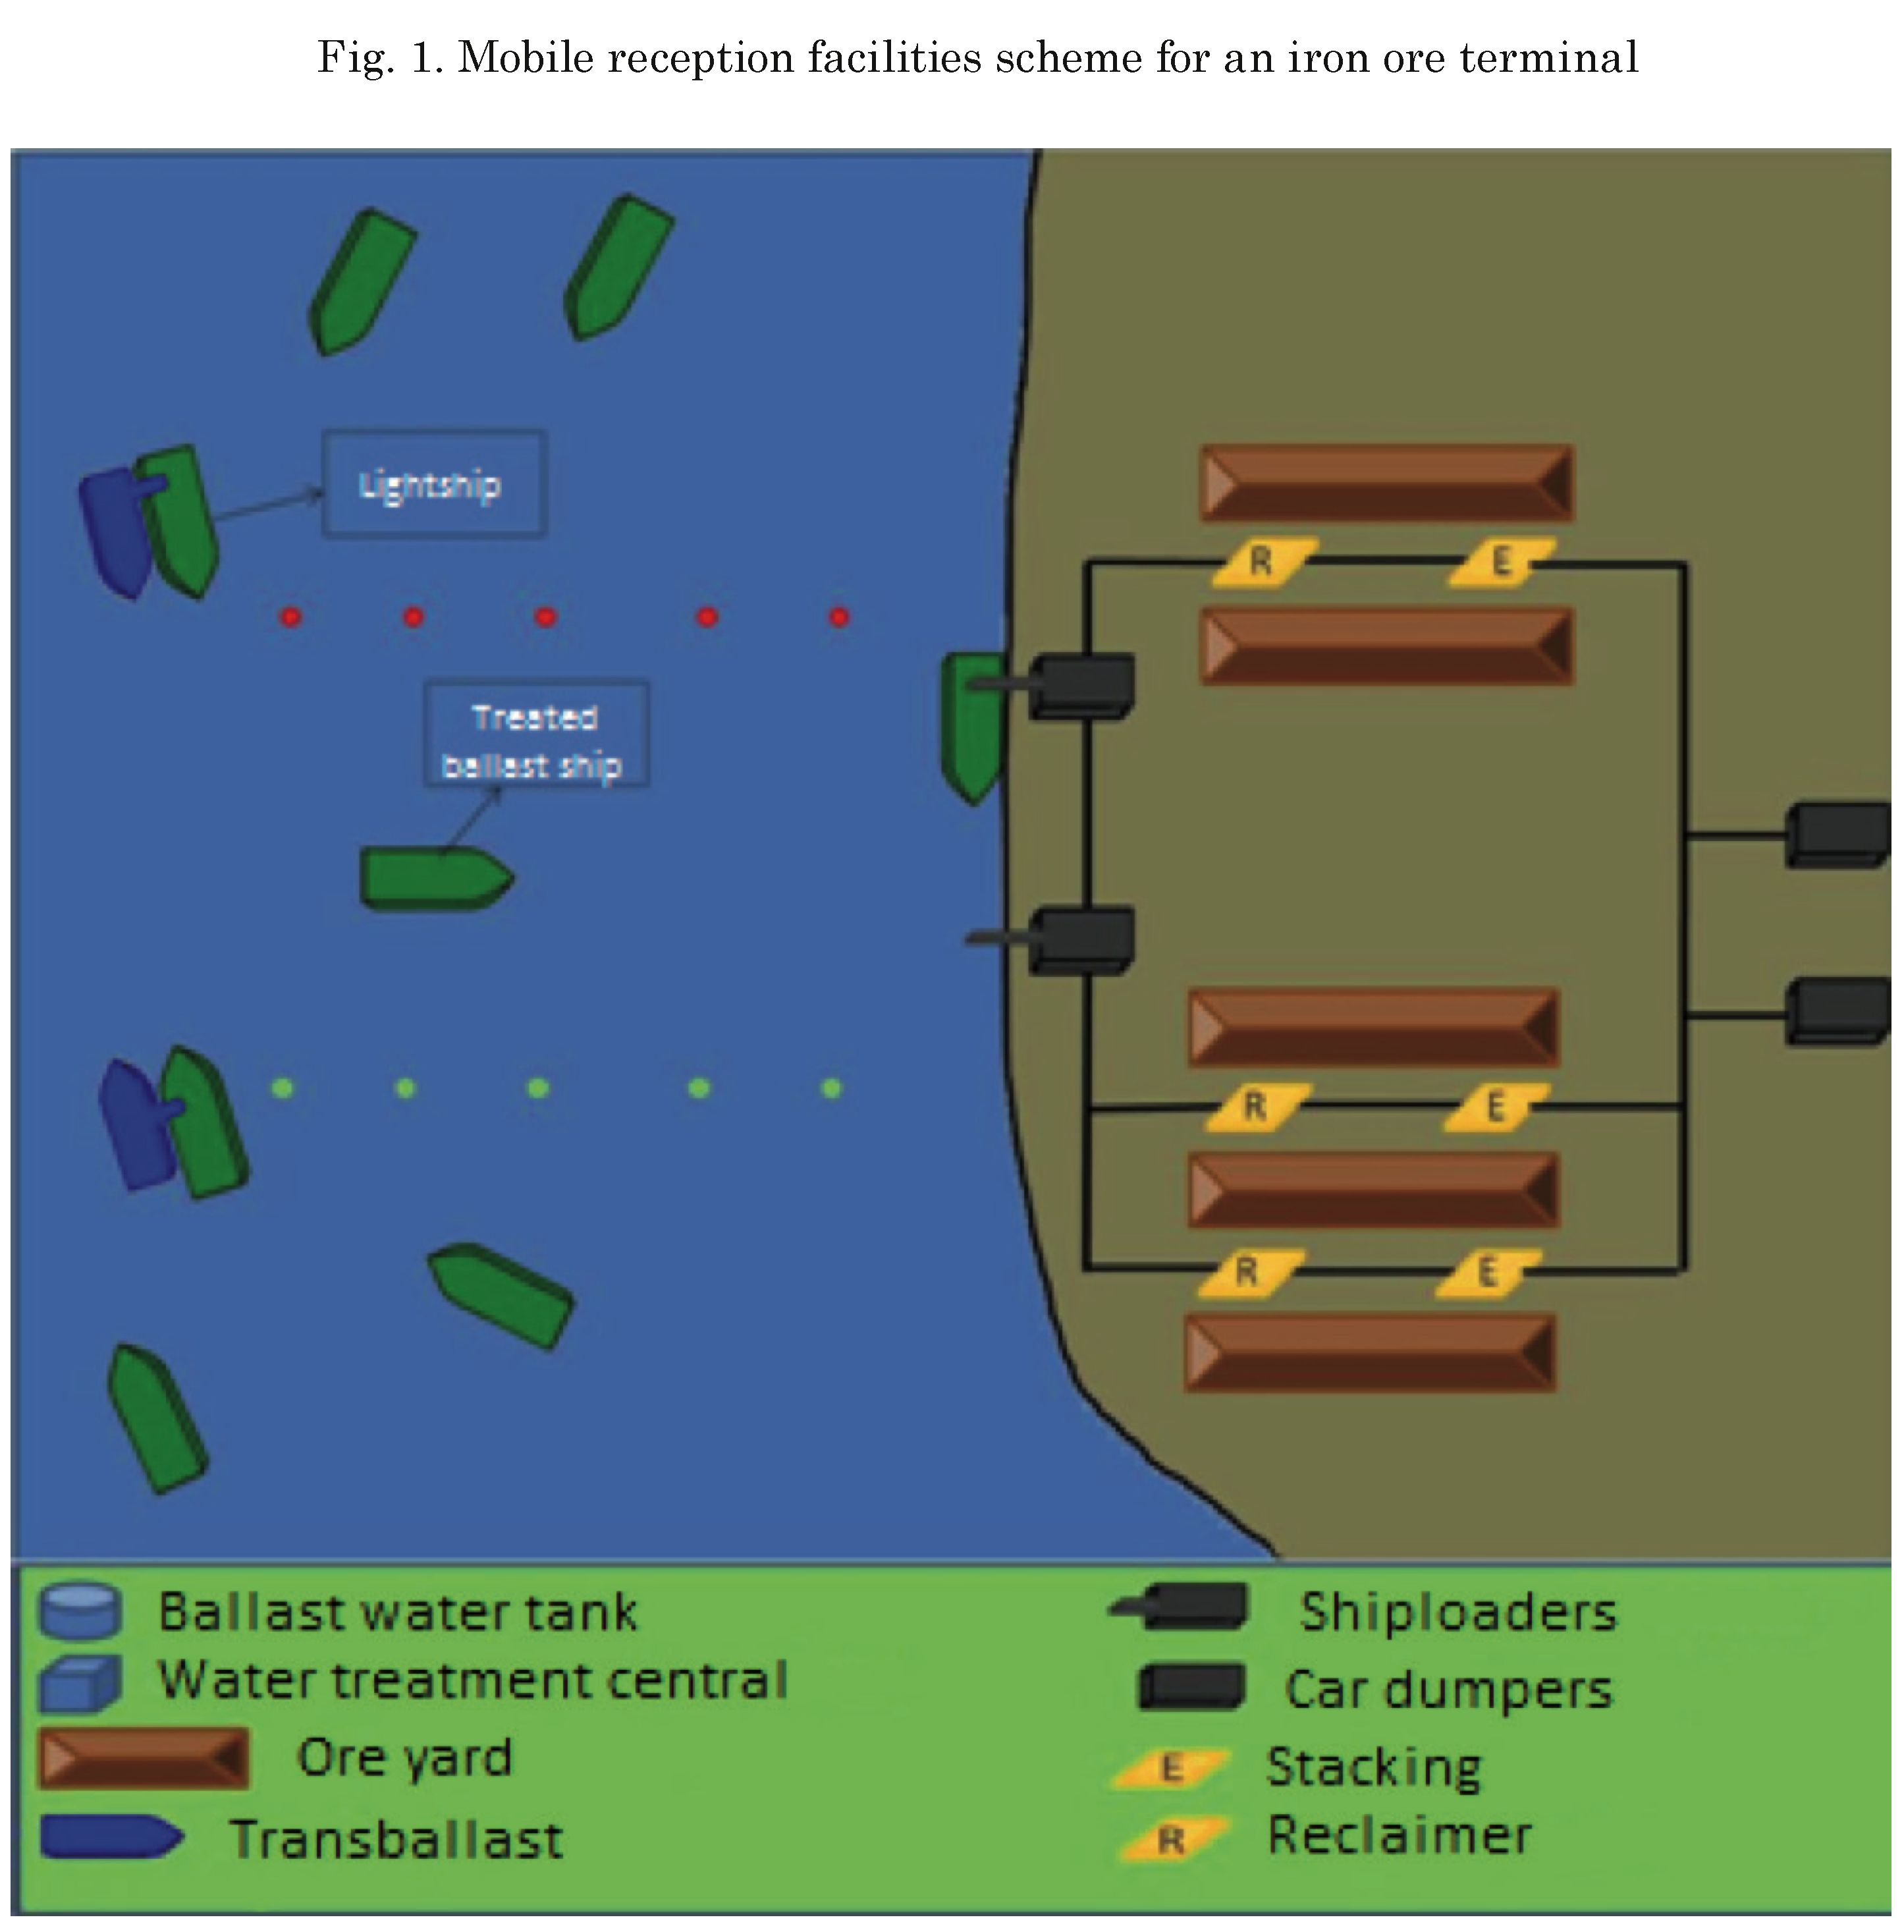
Option (2) has been approached in several scientific studies with no practical application (David and Gollasch, 2014) (McMullin et al, 2008) (Liu et al.,2011) . This treatment alternative was first reported in the Australian Quarantine and Inspection Service (AQIS) in 1993, and presented at the National Research Council in a book entitled “Stemming the tide: controlling introductions of nonindigenous species by ships' ballast water”. It can treat BW of ships that do not have treatment installations on board, or also catch ballast water from ships and transport it to a coastal treatment unit. (McMullin et al, 2008) evaluated the usage of barges to capture ballast water from ships. (Pereira and Brinati, 2008) explained that this kind of transport might also be done by deactivated tanker ships adapted to the operation. (Gollasch et al, 2007) suggest that this option is only applicable in special circumstances as in ports with berth limitation, similar to oil exportation ports where one or two ships can moor on the opposite side and operate at the same time.
The use of mobile reception facilities can be applied to solve onboard ballast water issues and assembling onboard barges or trucks. These mobile reception facilities may be brought alongside the vessels. However, ships such as container vessels, continuously need to ballast/deballast in port areas according to the cargo handling.
On the other hand, (Pereira, 2012) demonstrates that (2) solves a discussion related to delay in operation and area disposal for assembly treatment tanks at port terminals. However, impacts in port operations are less meaningful (Pereira and Brinati,2012) . Since not all the treatment is performed at the berths area, this system presents greater flexibility regarding conventional BWTO.
The BWT at the port is also feasible (Donner, 2010) (Jingetal, 2010) (Pereira and Brinati, 2012) (Minkelis, 2012). Operational viability of this system for ballast water treatment was presented by (Pereira and Brinati, 2012). Valdez port treats around 10 million cubic meters per year (Mm3/ year) and Scarpa Flow has reception and treatment stations that are able to perform 16 Mm3/year, including ballast oil from the water. Ballast water of ships is then collected and treated onshore (Gollasch et al, 2007).
None of these analyses considered the installation of a Ballast Water Desalination Plant (BWDP). (Donner, 2010) presented this system as likely to solve environmental issues generated by ballast water. The great advantage of desalination stations is the possibility to install a conversion plant far from the water caption point. Thus, if a port has any area restriction to receive tanking, there is no concern about this operation. For instance, in the Arab Emirates there are desalination plants in the coast that convert the water and conveys it to distances longer than 30 km (Ahmed, 2001). Desalination plants are installed around the world as a means to provide fresh water to regions with limited drinking water availability. These plants are installed in the Arab Emirates, Israel, Australia, United States, Mexico and Brazil, at Fernando de Noronha Island. (Donner, 2010) explains that building a desalination plant with sufficient capacity would not be a concern considering that great cruise ships currently operating already hold 3,000 m3/day desalination plants.
There are two desalination alternatives: thermal and reverse osmosis. These two alternatives proved to be very efficient to eliminate exotic species. The thermal treatment rises the ballast water temperature to above 45°C since present organisms die at this level. Reverse osmosis occurs with water going through a series of high pressure membranes. This process is essential to disaggregate the organisms in the ballast water because of the membranes denseness (Castaing, 2010). Chemical substances that eliminate organisms might be added during pre and post treatment.
Ballast water treatment systems on board ships might use filtration. The filter thickness at desalination is lower than on board ships. The desalination plant requires filters between 0.1m and 0.2 m in thickness (Çakmakce et al, 2008) while on board ships may vary from 10 to 50 pm (David and Gollasch, 2014) due to possible clogging. This only reinforces that desalination is more efficient at separating microorganisms present in ballast water compared to onboard systems. There are no residue treatment issues; however, its efficiency is guaranteed when applied. Hence, desalination is used as an on land alternative and it is not necessary to implement other BWTO systems.
Adaptations to the simulation computational model where considered for (2); ballast water treatment was only used at the backshore. Hence, all the ships that arrive at the port area may have to wait for treatment before entering in it. Ballast water reception and conversion was implemented for (3) together with sea water caption whenever the berth was not occupied by a ship. This implementation is necessary to guarantee higher desalination plant occupation rate.
We used the same input data presented in (Pereira and Brinati, 2012). Simulations were made at The Port of Tubarão (Port 1), which handles approximately 90 million tons annually (Mta) and receives ships from 60,000 to 400,000 Deadweight Tonnage (DWT) unloading around 25 Mm3/y. The Port of Sepetiba handles approximately 50 Mta (forecast for 2015 for port 2) and 25 Mta on port 3, respectively.
Results demonstrated that for option (2) there is an increase of 1.90 days in the average waiting time for ships that moored in Port 1 considering an optimized fleet to attend the demand. This effect is a result of ships retention on backshore for BWT even when berths are free for operation. Even in these conditions, all projected transport demand was attended. These results confirm the premise (Gollasch et al, 2007) that treatment on land may generate delays on port operations when the mobile alternative is applied with a few shuttle fleets. It was observed that for desalination BWT the average waiting time and berth occupation rate remained at the same level presented in (Pereira and Brinati, 2012). The major difference between the systems is sea water caption to expand desalination plant operational capacity. The captured volume from ships and from sea ratio was about 37%. This effect is explained by the ships maneuver time and the non-occupied berths.
Thus, this study completes the evaluation of onshore ballast water treatment alternatives discussed in the literature. The focus on iron ore terminals is explained by the high ballast water volumes that is transported by these ships. We have made the analysis considering the same volumes proposed by a previous study (.Pereira and Brinati, 2012). However, those terminals may have changed transport volumes. Once again, our final conclusion is that onshore treatment is a possible option for those terminals to reduce the impact of organisms present in ballast water. On the other hand, these treatment options could offer port users a ballast water treatment service to be paid by ship-owners, who would not need to install any ballast water treatment system onboard.
The Port of Tubarão (Port 1) (a) is located in Vitoria, ES, and has 3 mooring berths. Berth 1 is divided in 1 (North) and 2 (South) and may receive 2 ships simultaneously. It is limited to ships of up to 200,000 DWT. Berth 2 serves ships with capacities greater than 380,000 DWT. The Port of Sepetiba (Port 2 under construction and 3) is located in Rio de Janeiro, RJ, and is a complex port that deals with different types of ships and loads. The iron ore is handled by two companies in two different terminals. Two terminals were selected: (b) a port under construction, designed to operate with two berths in the first phase in 2015 following a ramp up in cargo handling; and (c) a port that operates with one berth and receives ships of up to 180,000 DWT.
A discrete event simulation model was developed and called TRANSBALLAST, version 2. This model was originally presented in (Pereira and Brinati, 2012) to treat ballast water in port (1). Prom this model, two new models were developed to allow simulating two new onshore treatment conditions: (2) mobile treatment for the anchorage area and (3) port treatment using a desalination station.
The mobile system consists of treating ballast water in backshore while other ships wait to moor in port. This system is a fleet of shuttle tankers with an onboard treatment system (oceanic barges or simple hull ships) that picks up and treats ballast water from ships in backshore.
Ships might only moor at port berths after the ballast water transfer has been conducted. Ships usually discharge part of their ballast water during navigation, throughout the access channel and when arriving at the mooring berth, affecting the ports’ surrounding environment. This system aims to prevent this water from being discharged at the adjacent port. This alternative treatment is shown in Pig. 1.
The model firstly verifies the number of queuing ships waiting to access the port. Then, it verifies the availability of deballast and water treatment units. If at the moment when a ship arrives to the channel there is a treatment ship available, it is immediately assigned to deal with the ship that is queuing, respecting the Pirst In First Out - FIFO concept. Otherwise, ships wait in queue until a treatment ship is available.
After the ballast ship is mooring, the same logic of transfer system is applied, regarding the ballast water collection, transfer and treatment processes as shown in (Pereira and Brinati, 2012). Hence, when a ship moors, there is a pre-operation time to connect short manifolds ruled by a triangular probability distribution. Available treatment types for the mobile system is the same presented for the in land system.
Before starting the treatment, the model verifies the amount of ballast in ships and, during the transfer, verifies the total volume on board and removes the volume from the ship every 1,000 m3. When the volume on board is zero, the deballast ship unmoors and continues treating the residual volume inside its own tank. After finishing the
residual water treatment, the system verifies if there is any ship in queue and assigns a new operation.
Considering that the ship waiting time at the port area should be reduced to the minimum level, this type of alternative may induce higher times and block ship loading. Before starting the transfer, the model verifies the amount of ballast on board the ship, and during the transfer, it reduces the total volume removed from the ship every 1,000 m3.
When the on board volume is zero, a shuttle tanker unmoors and continues treating the residual volume inside its own tank. After the end of the residual water treatment, the system verifies if there is any ship accessing the channel or any berth and assigns it to a new operation.
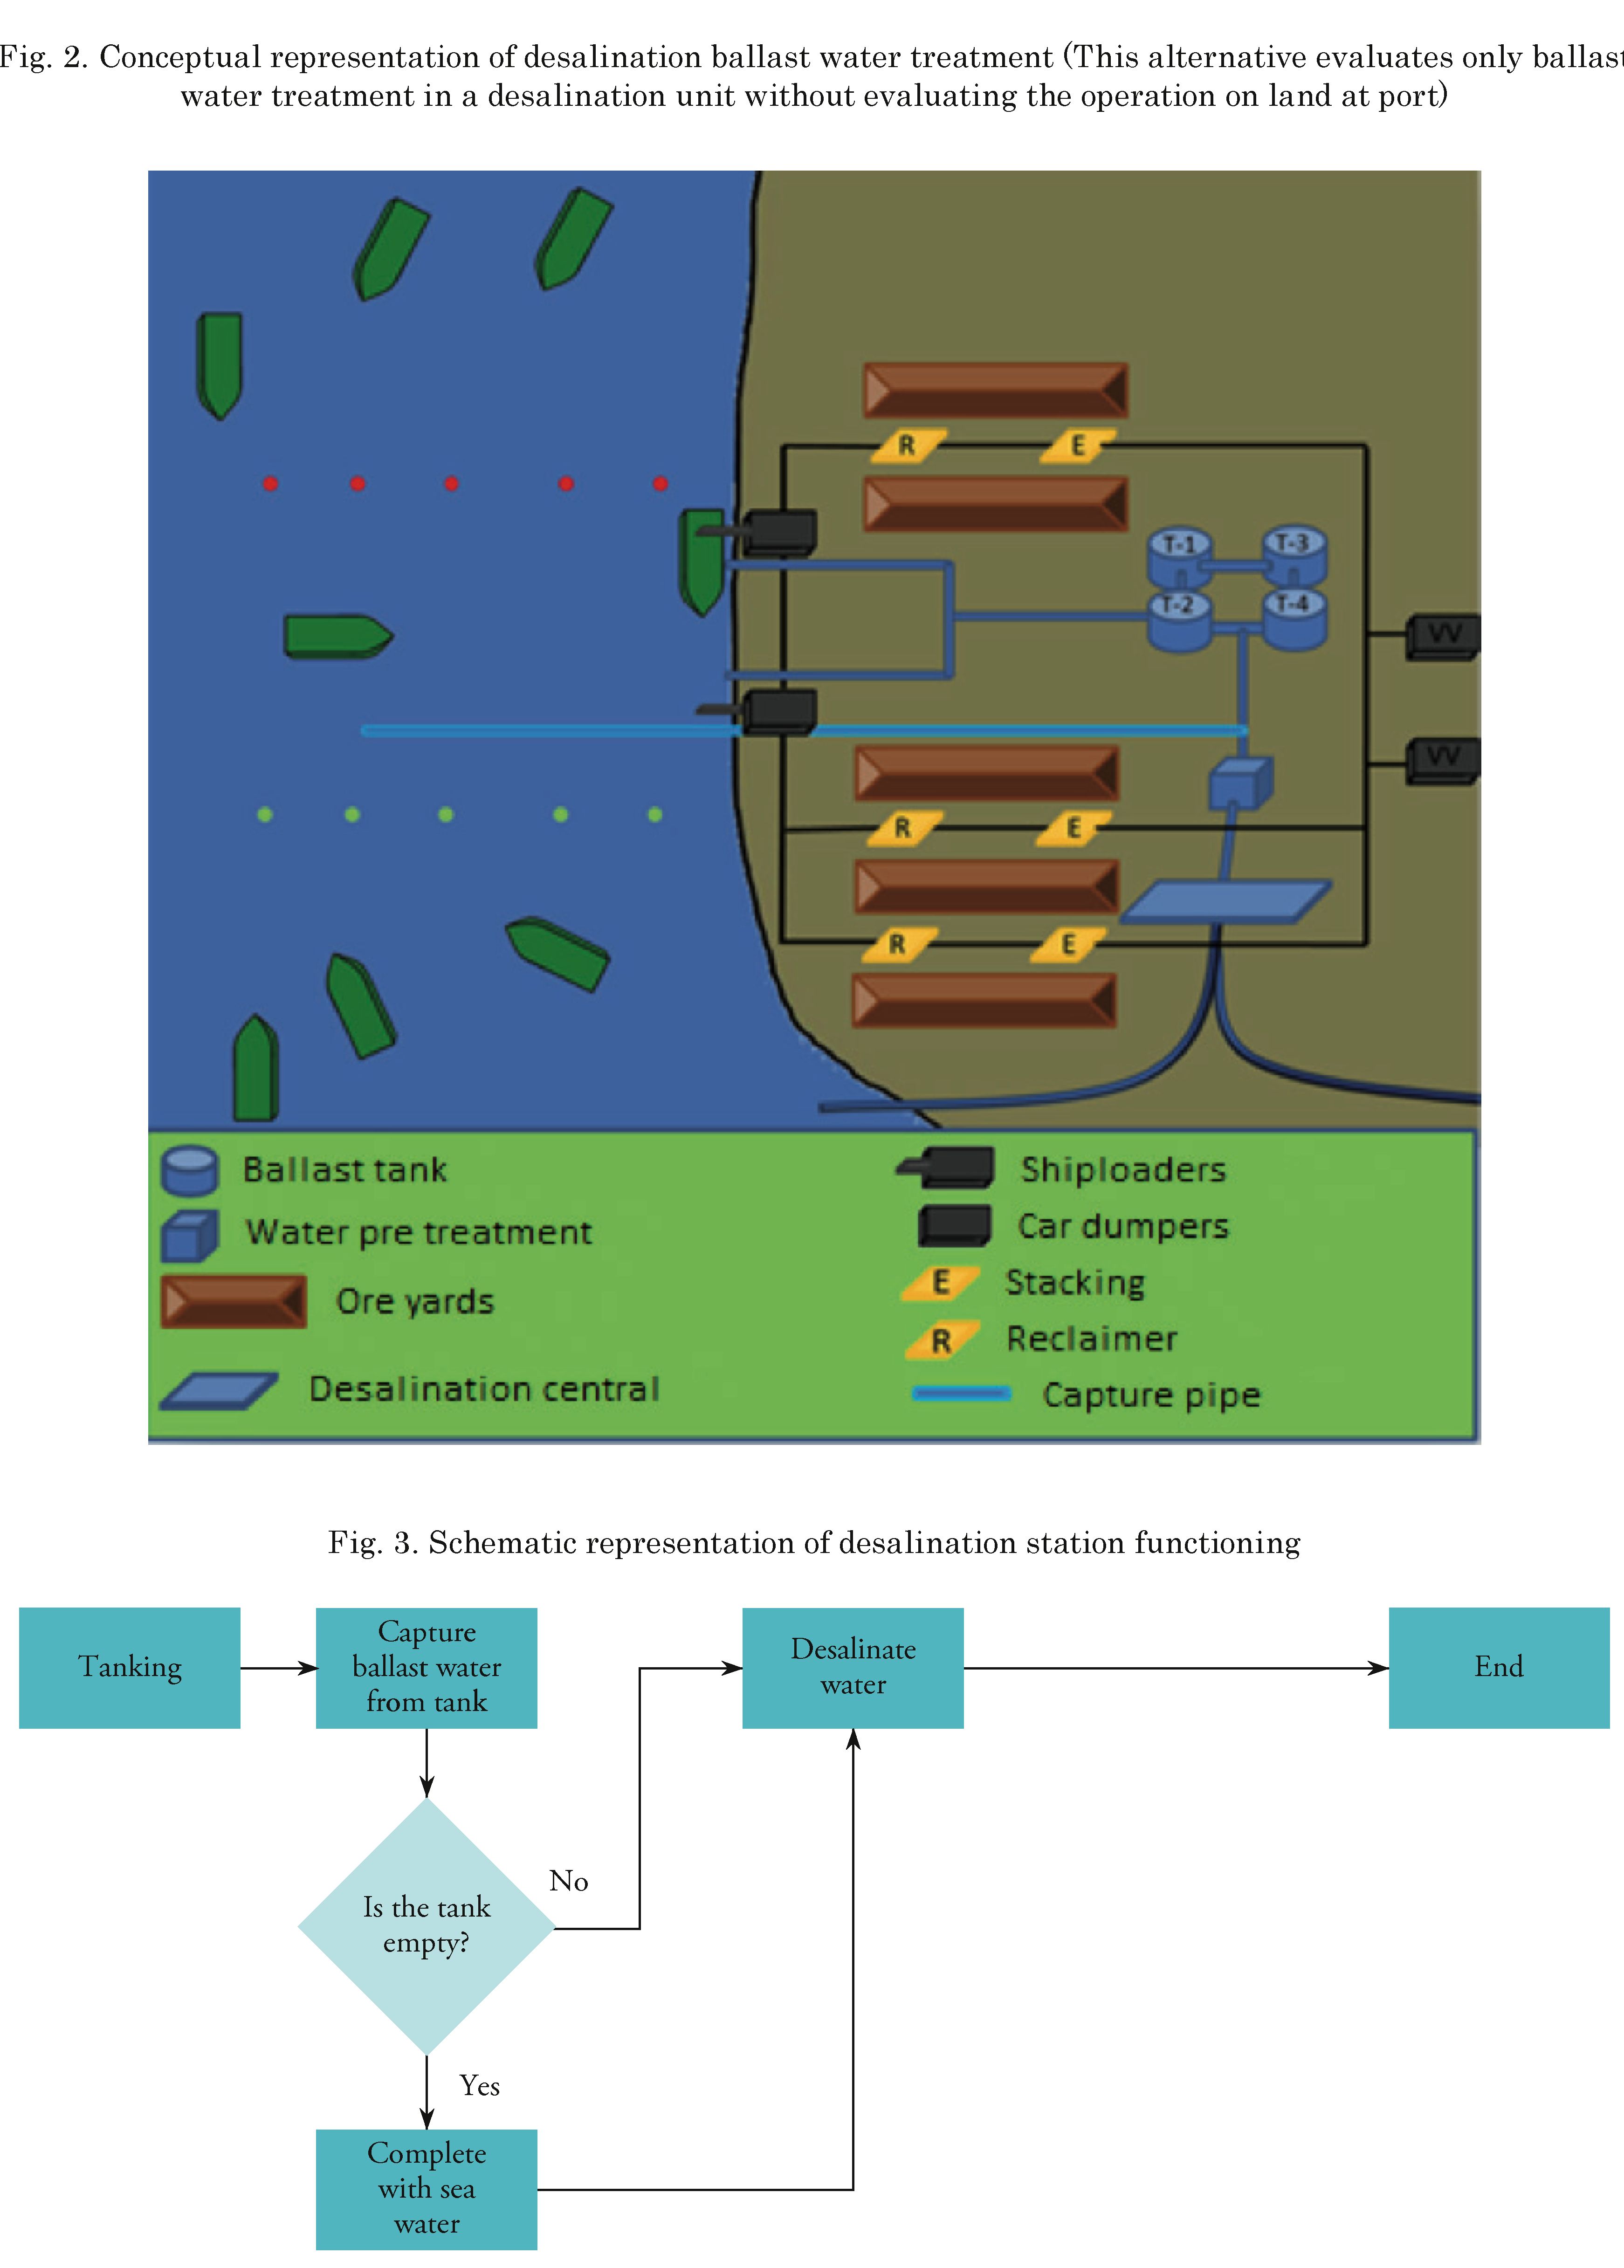
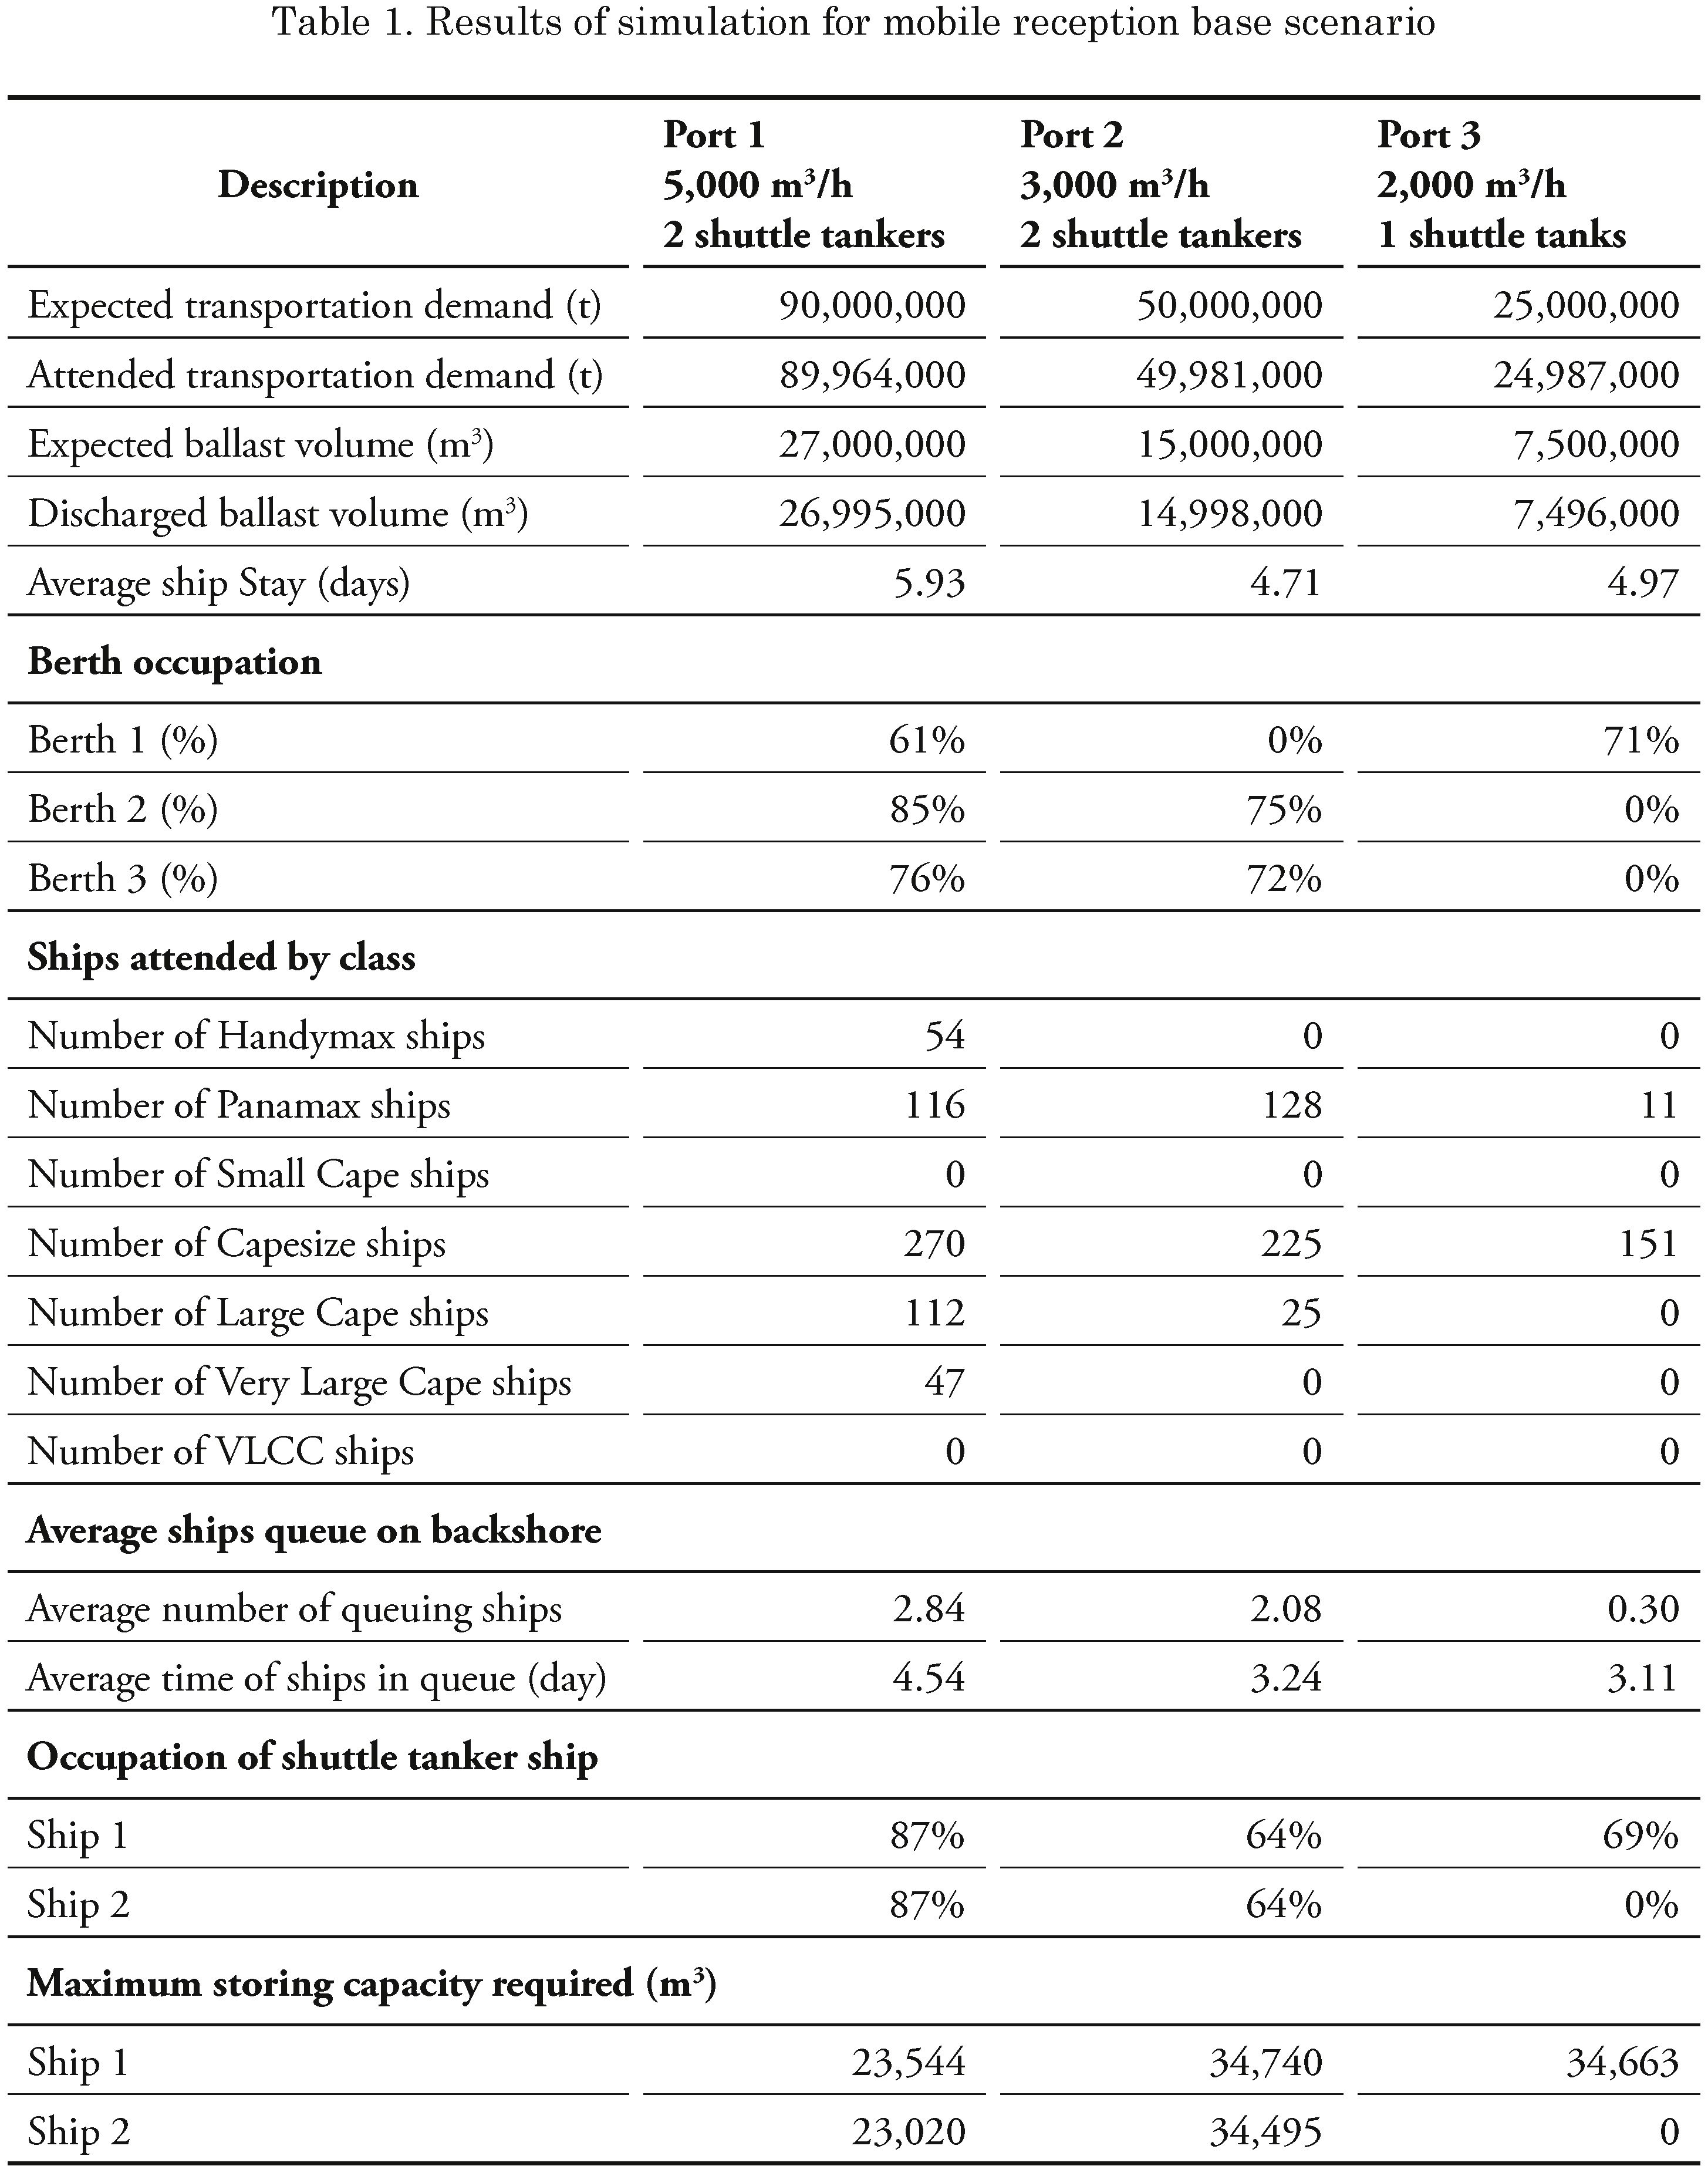
This system works together with the ballast water treatment in port; however, there is no treatment option to eliminate exotic species. It also generates fresh water. The model calculates the stations’ occupation according to the ballast water volume received every day and the desalination rate (m3/h). If the tanks’ volume is not enough to feed the desalination station with ballast water, sea water is used as shown in Fig. 2 and Fig. 3.
Ballast water captured from tanks processes for feeding a desalination station should guarantee that the plant fully operates within the time available. The model assumes that the station works at 99% occupation rate including ballast and seawater, whenever necessary.
Through statistics from the simulation model, we might be able to determine the frequency and time period when sea water caption is necessary to guarantee the total usage of the desalination station.
The scenarios developed for simulations considered two treatment alternatives: (a) shuttle tankers and (b) desalination stations. Specific parameters were adopted for each alternative. General premises for these simulations were already presented in (Pereira and Brinati, 2012). Only the specific premises will be presented for the simulations of those two alternatives as follows.
The capacity of the shuttle tankers is associated to two parameters: (a) capacity of ballast waters on board the largest ship that moors at the terminal; and (b) ballast water treatment rate of shuttle tankers.
The proposed model determines the average occupation level of shuttle tankers. It is assumed that after the main ship finishes transferring ballast water to the shuttle tanker, the ship is free to moor at the berth and the shuttle tanker is ready for the next operation. The shuttle tanker should finish treating all the ballast water inside the tank. After completing a waiting time that may vary from 0 to 24 hours according to a triangular distribution that aims at representing the effect of stops on possible preventive maintenance, supply and crew changes, the shuttle tanker returns to operation.
In this evaluation, Very Large Ore Carrier (VLOC) ships might also be considered to moor at Port 1, being served by the system proposed.
Premises for simulation
To simulate this alternative, the principal premises are: (1) number of shuttle tankers; (2) treatment capacity rate of shuttle tankers (m3/h); (3) navigation time from the backshore to the port (h); and (4) loading rates of ships at berths (t/h).
Expected results
By imputing this data into the simulator, we may obtain the following outcomes: (a) average queuing time of ships in backshore; (b) average number of queuing ships in backshore; (c) ship stay in backshore (days); (d) fleet of shuttle tankers and their respective capacities (m3); and (e) occupation rate of shuttle tankers (%).
By possessing these real outputs, the results of the model might be evaluated as well as the impact of the solution proposed for each port shown in (Pereira and Brinati, 2012).
One of the principles of the desalination station is holding up a continuous flow of water supply for the conversion of treated fresh water. It is important to highlight that there are stops during the operation of ships other than vacancies due to the lack of ships. To minimize the effects, salt water may be stored in tanks to be later destined to the desalination station in a constant outflow (m3/h).
Premises:
To simulate this alternative, the following premises are included: (a) outflow of tanks to the desalination plant (m3/h); (b) average desalination rate (m3/h); and (c) percentage of fresh water generated by the desalination process (m3/h).
Results expectec:
Other than the results presented by (Pereira and Brinati, 2012% adding the following is expected:
(1) flow entry of desalination station (m3/h);
(2) frequency of stops of tank pumping; and (3) extracted sea water volume per year (m3). To validate this system, the same results presented in (Pereira and Brinati, 2012) are used.
Results generated by the simulation model may be compared to the results presented in (Pereira and Brinati, 2012). Considering that the validation scenario adopted was the same, we consider that the comparison of those results impacts each one of the simulated alternatives.
Input parameters
The input of parameters to the simulation model are the number of shuttle tankers, corresponding to the discharged ballast water storing capacity (m3) and treatment rate (m3/h). Different parameters sets were considered. The average time assumed for the shuttle tanker mooring operation to the ship and coupling of short hoses to collect ballast water is 2 hours, according to the information collected from shuttle tankers operation within FPSOs.
Base scenario results
Table 1 presents the results for each of the ports using alternative (2). It should be pointed out that these results correspond to better tested configurations.
The results presented for this alternative consider the following. Port 1: ideal configuration for the system is obtained with 2 shuttle tankers, each of them with a treatment rate of 5,000 m3/h. It can be noted that with the adoption of this treatment system, there is an increase of 1.90 days in ship staying time if compared to the results presented in (Pereira and Brinati, 2012). This increase
is intuitive as long as the ship may arrive at the backshore and there is a berth available; however, it stays on hold to perform ballast water transference. It impacts directly on the ship queuing average time. As expected, the berth occupation rate remains constant since the port continues to serve the same number of ships. The effect is focused on the availability of the arrival of ships to the berths. It might be observed that the shuttle tankers occupation rate is 87%. There is still a 13% gap in the system that might absorb the demand increase for the terminal, as it considers that established premises are conservative. Obviously, it may be noted that this rate has been impacted by time
distribution to new imputed missions in the model. Another important subject is that in relation to the high treatment rate (5,000 m3/h), the maximum occupied capacity of tanks remained at 23,500 m3. Two Handymax ships would be enough to deal with all the ballast water volume discharged at the terminal. There are treatment systems in the market with this capacity that could be installed onboard shuttle tankers.
Port 2: The composition suggested for the system was 2 shuttle tankers with a treatment rate of 3,000 m3/h. The average stay was 4.71 days. The occupation rate of shuttle tankers is 64%. Hence, as the 3,000 m3/h treatment rate is less than that in Case 1, an opposite effect occurs in which the maximum occupied capacity of the tanks was 34,700 m3. The rate increases due to the need to store more water where treatment is occuring. For the 5,000-m3/h
treatment rate, the capacity of the tank is 16,000 m3. For this system, two Handymax ships are needed to deal with all the ballast water volume discharged at the terminal, in relation to the time for a new ship operation, varying from 0 to 24 hours.
Port 3: The composition suggested for this system was 1 shuttle tanker ship with a 2,000 m3/h treatment rate. The average stay was 4.97 days. The increase of the treatment rate reduced the stay time in 0.10 days for 3,000 m3/h and 5,000 m3/h; however, it does not mean there is a significant benefit to system. The increase in the average time in queue is analogous to the increase of ship stay. It might be observed that the shuttle tankers occupation rate is 69%. The tanks maximum occupied capacity is 34,600 m3. For this system, one Handymax ship is necessary to deal with all the ballast water discharged at the terminal.
An important consideration about this system is that there is no type of interference in the existing port system, i.e., all the operation occurs outside the port area.
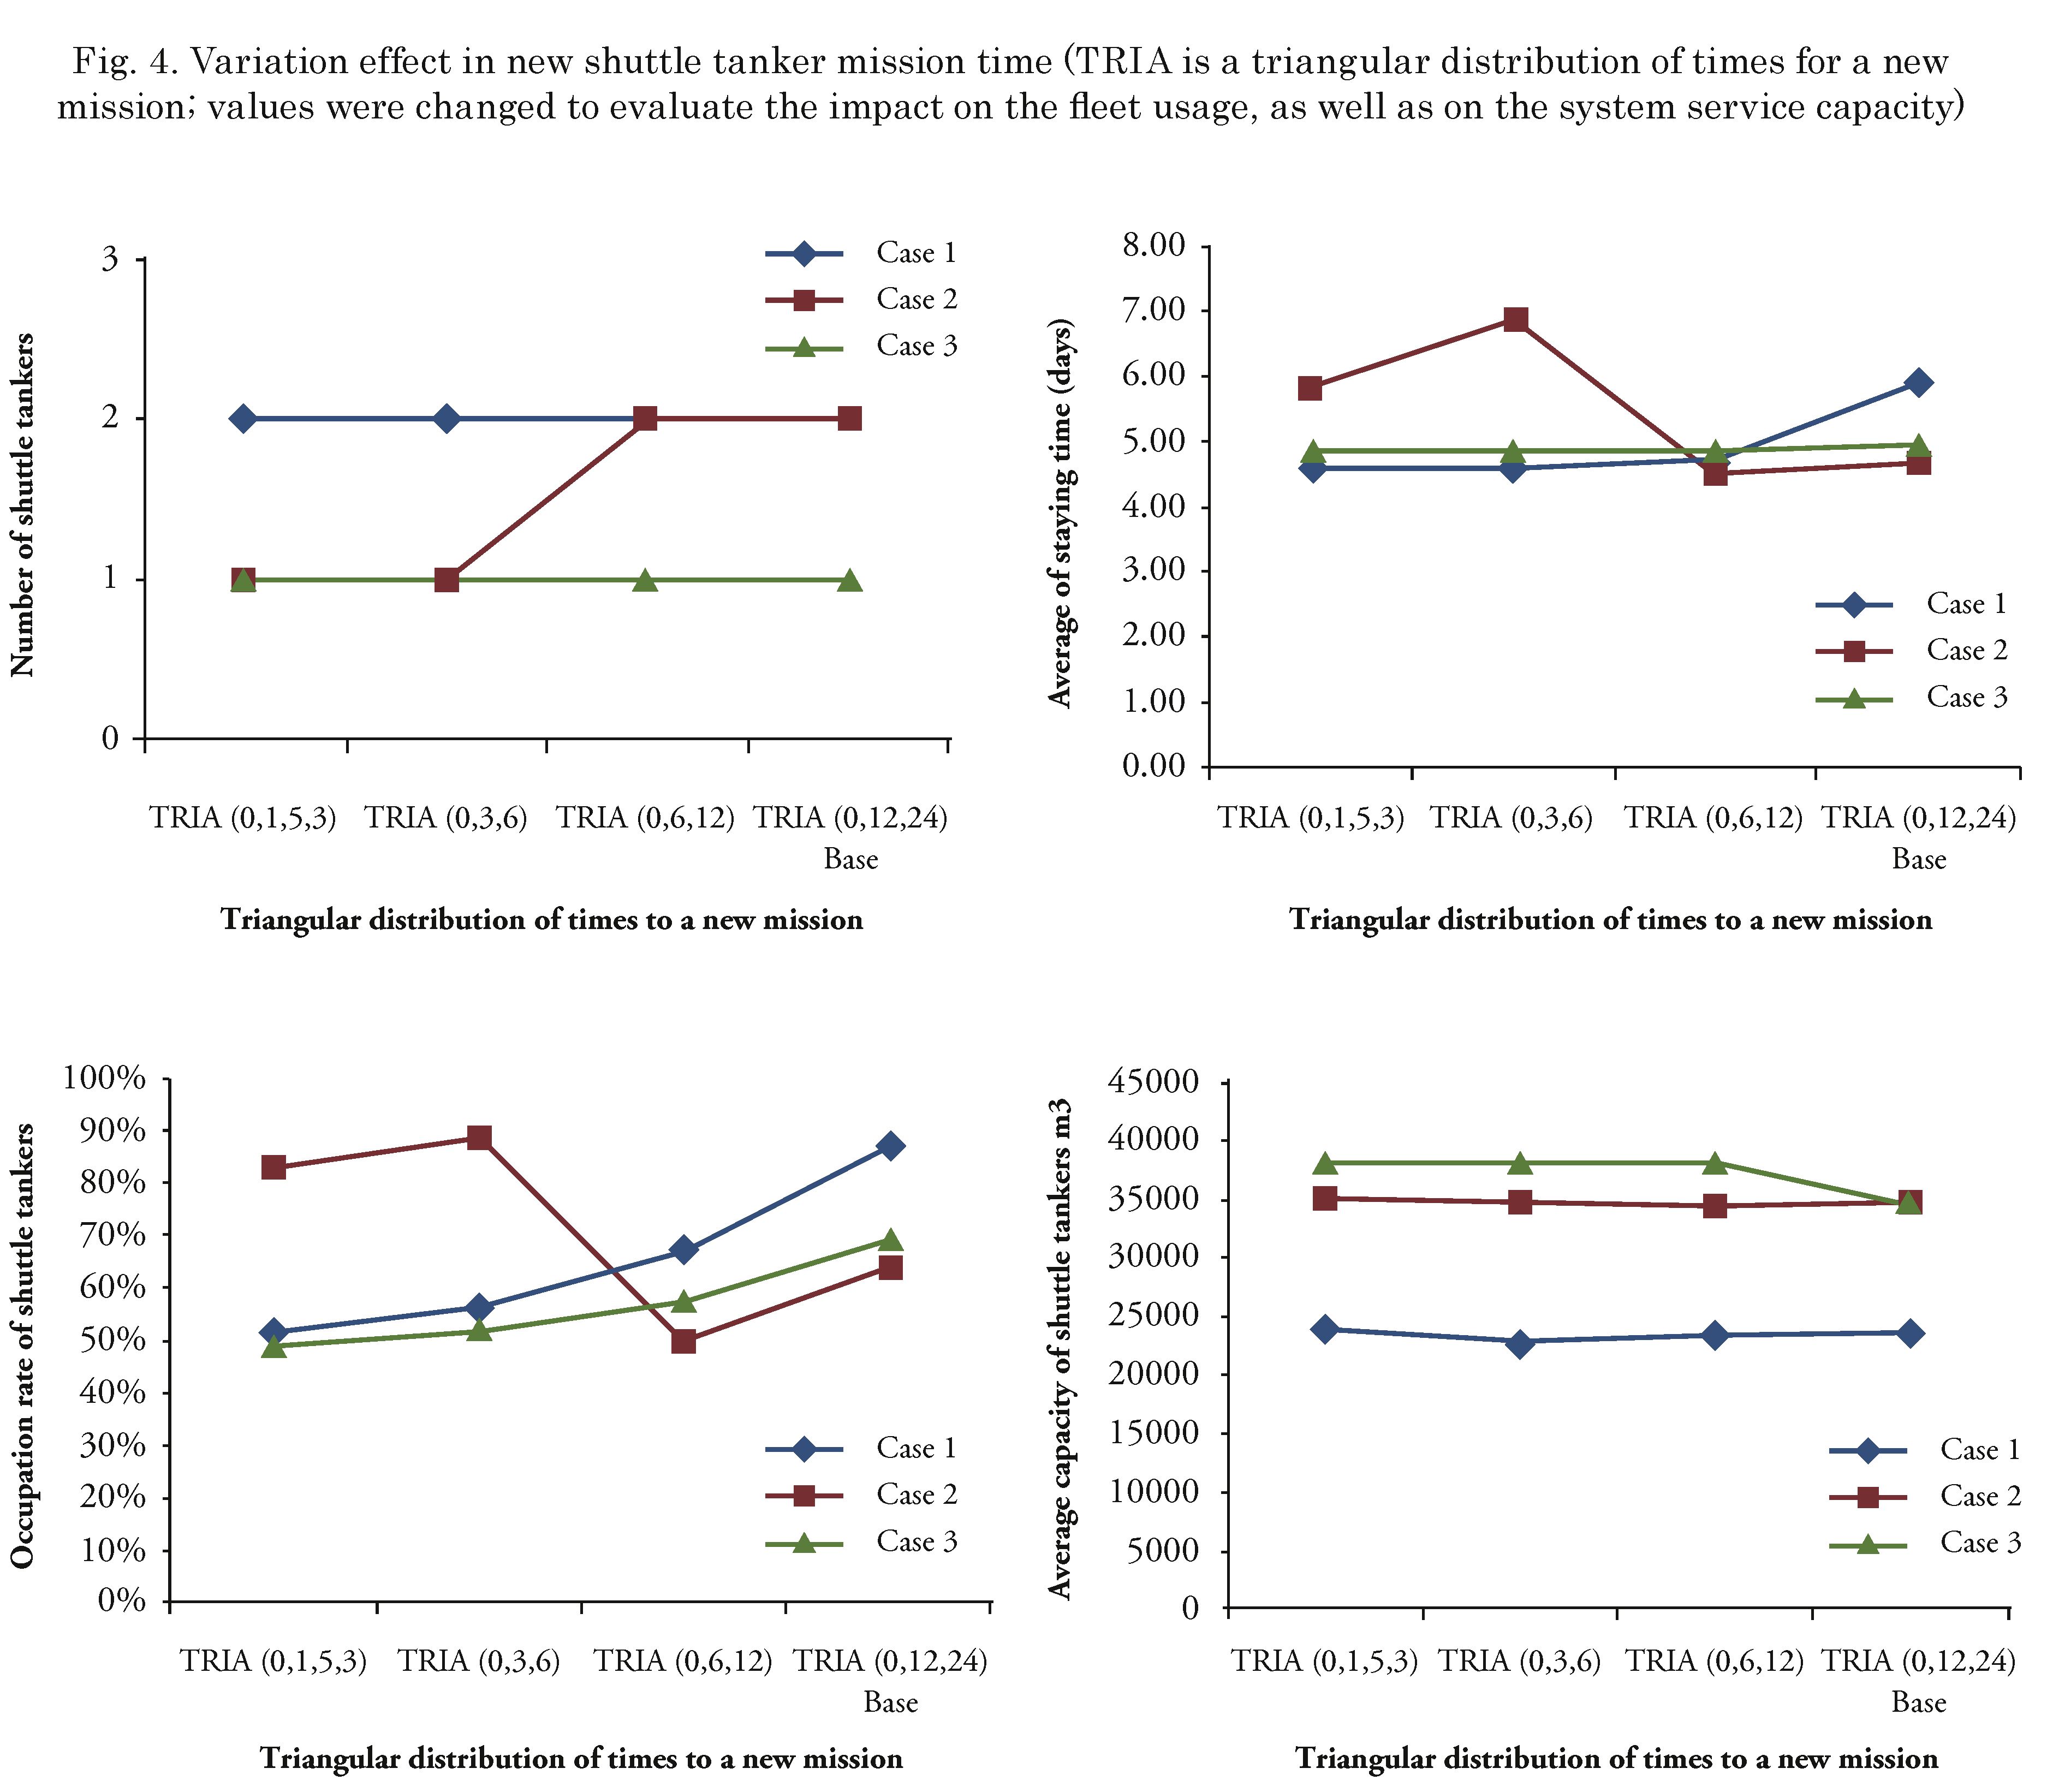
However, the time proposed for a new ship operation is a parameter that has a direct influence in determining the shuttle tanker fleet size. Hence, sensitivity analysis was performed considering this time variation, as shown in Fig. 4.
A reduction in time for a new mission affects the number of shuttle tankers for Port 2. It might be verified that time after time, TRIA (0, 3,6) reduces one ship. This analysis is important because there is a great uncertainty about operational times for ballast water treatment. The reference used was oil operation and there is a significant difference between those two operations.
Impact of operation of VLOC ship in case 1
We tried to evaluate the VLOC ships operations impact on the system proposed (5,000 m3/h treatment rate and 2 shuttle tankers). Results
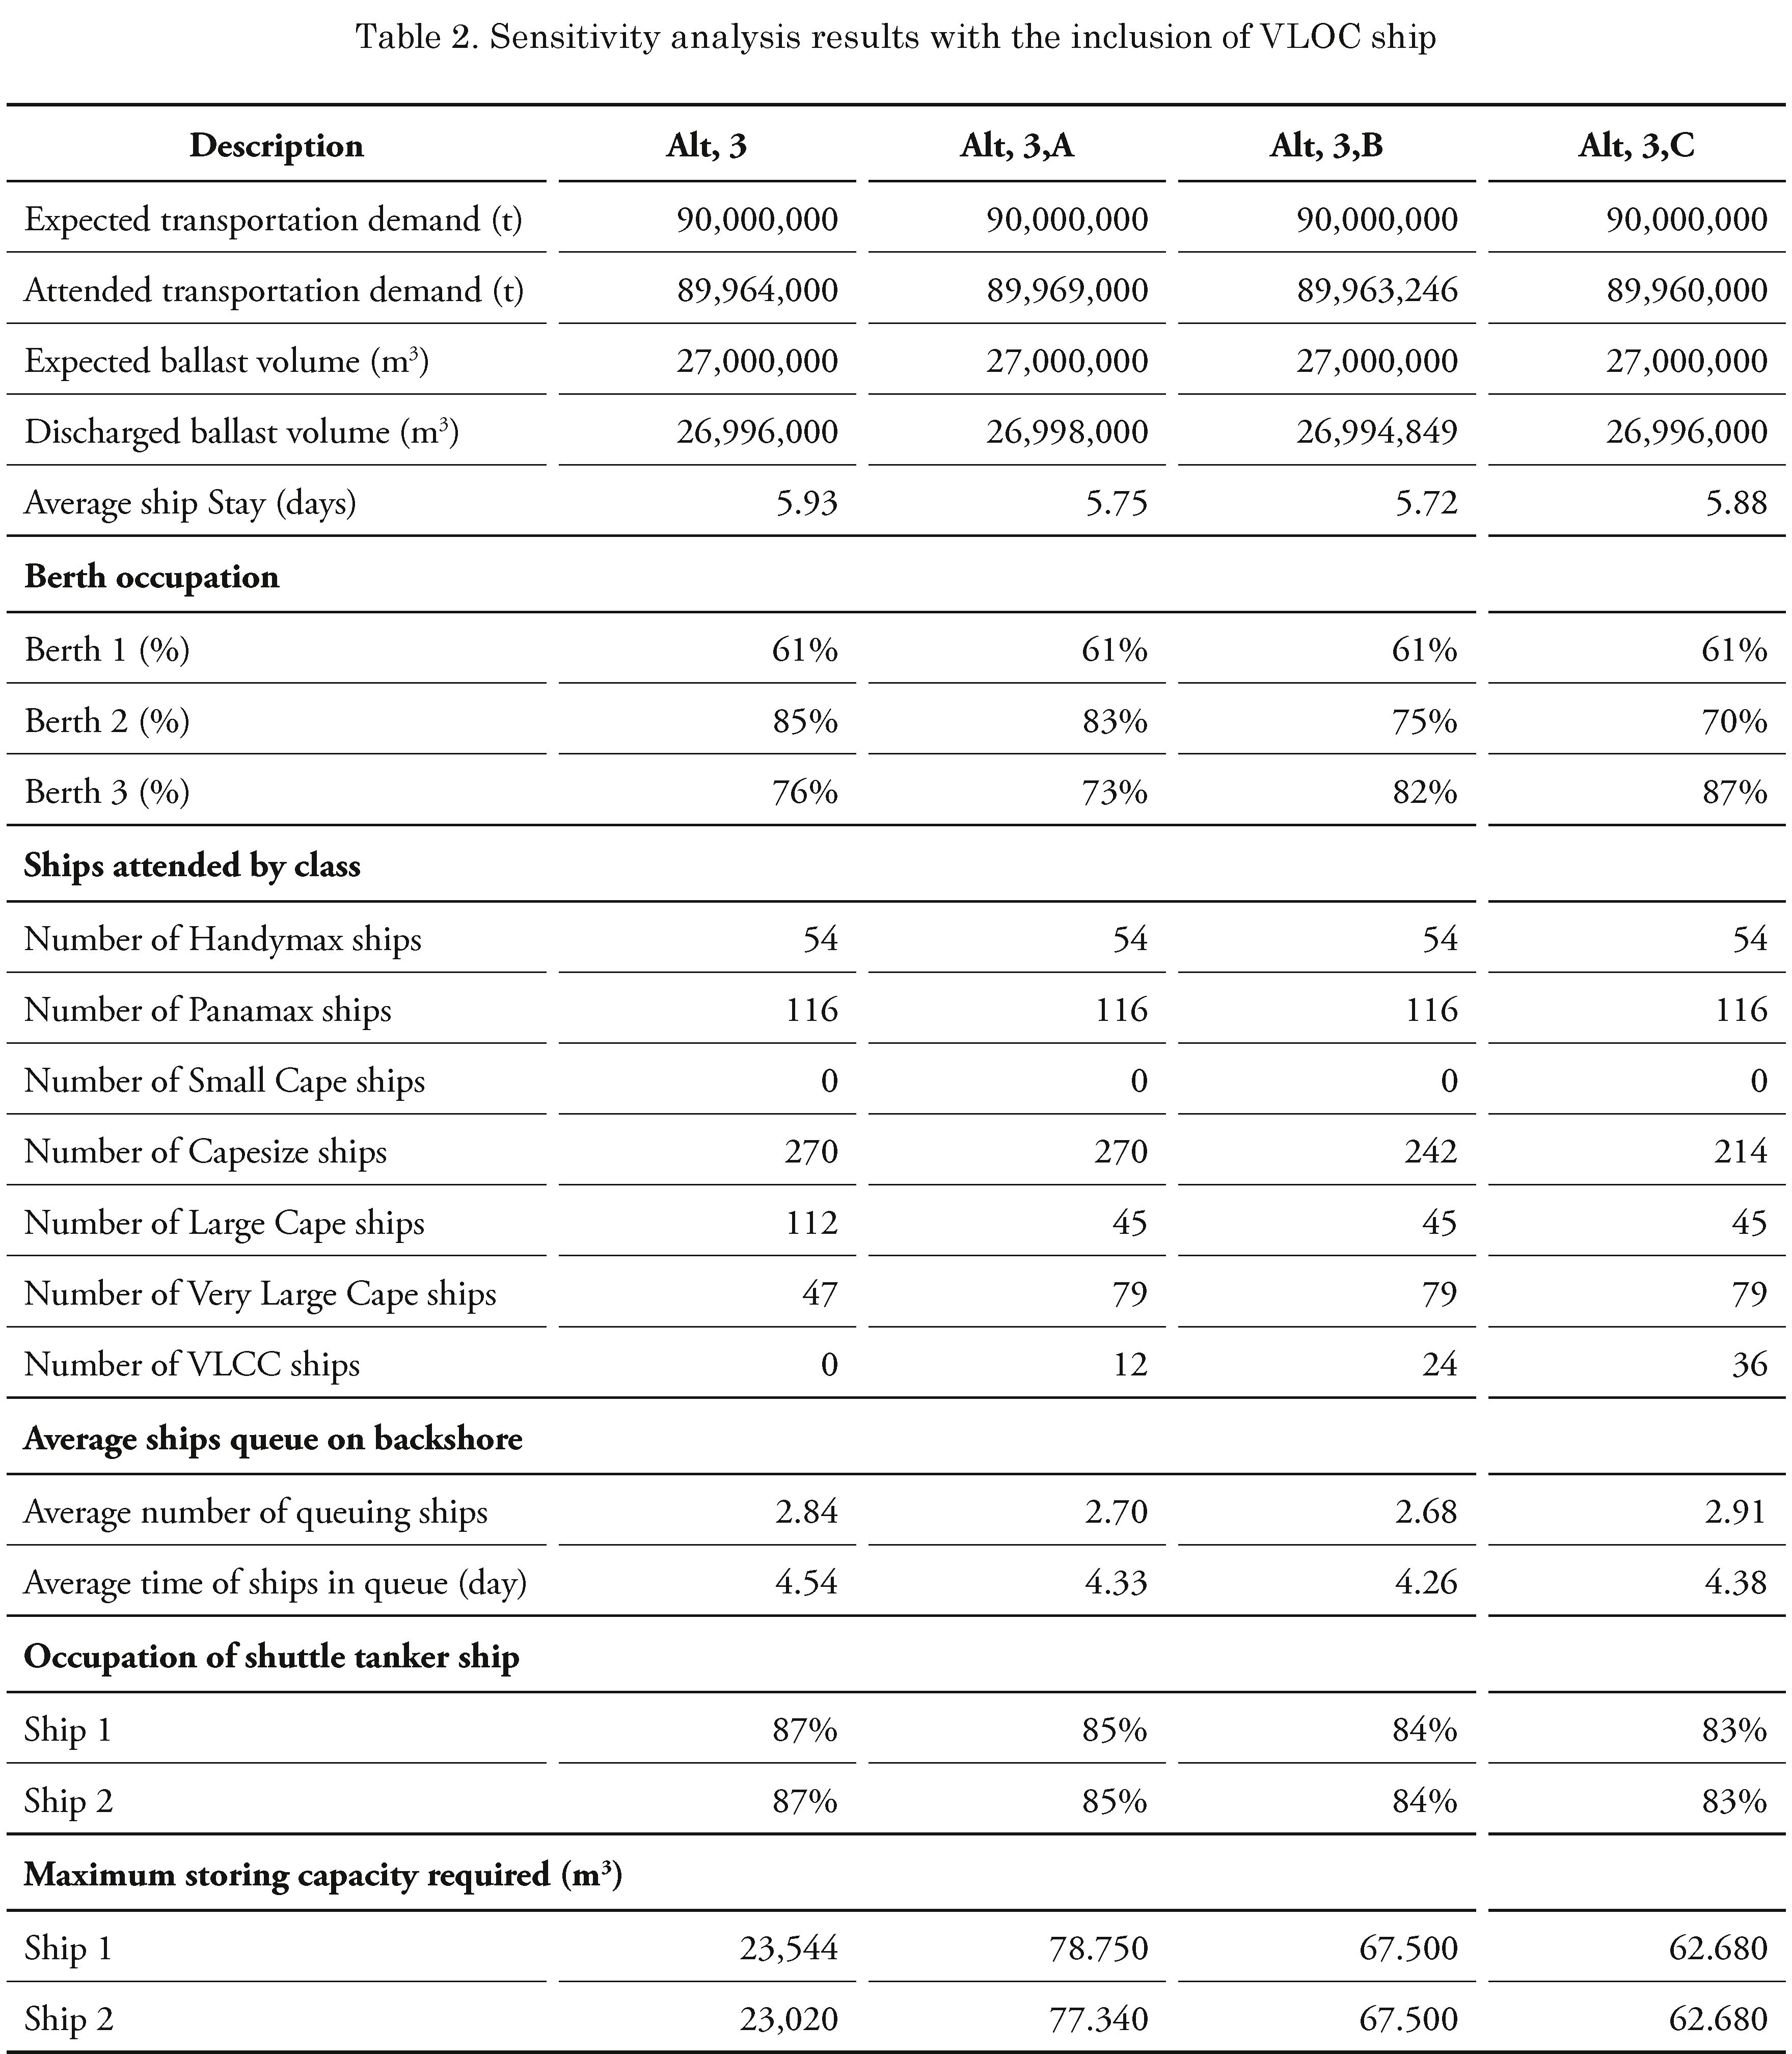
are divided in the following order: Alternative 1: without VLOC ships inclusion; Alternative 3,A: VLOC ships inclusion, transporting 5% of demand: Alternative 3,B: VLOC ships inclusion, transporting 10% of demand; Alternative 3,C: VLOC ships inclusion, transporting 15% of demand. The premise assumed that part of the transported demand by capesize ships will be transferred to VLOC ships, Table 2.
VLOC ship inclusion in the system impacts the average waiting time of ships regarding the Base Scenario. In alternatives 3,A and 3,B> a small reduction is verified at the stay time. This result was expected after the reduction of the number of ships at the terminal. However, for alternative 3,C, there is an increase due to a larger number of VLOC ships. Regarding port impacts, the berth occupation rates were not changed (Pereira and Brinati, 2012). A decrease in theshuttle tankers occupation rate was observed when the number of VLOC ships increases at the terminal. In this
case, the average capacity of tanks is 70,000 m3. In other words, 2 Panamax ships are necessary to serve the system regarding the high volume transported by these ships at an average of 120,000 m3.
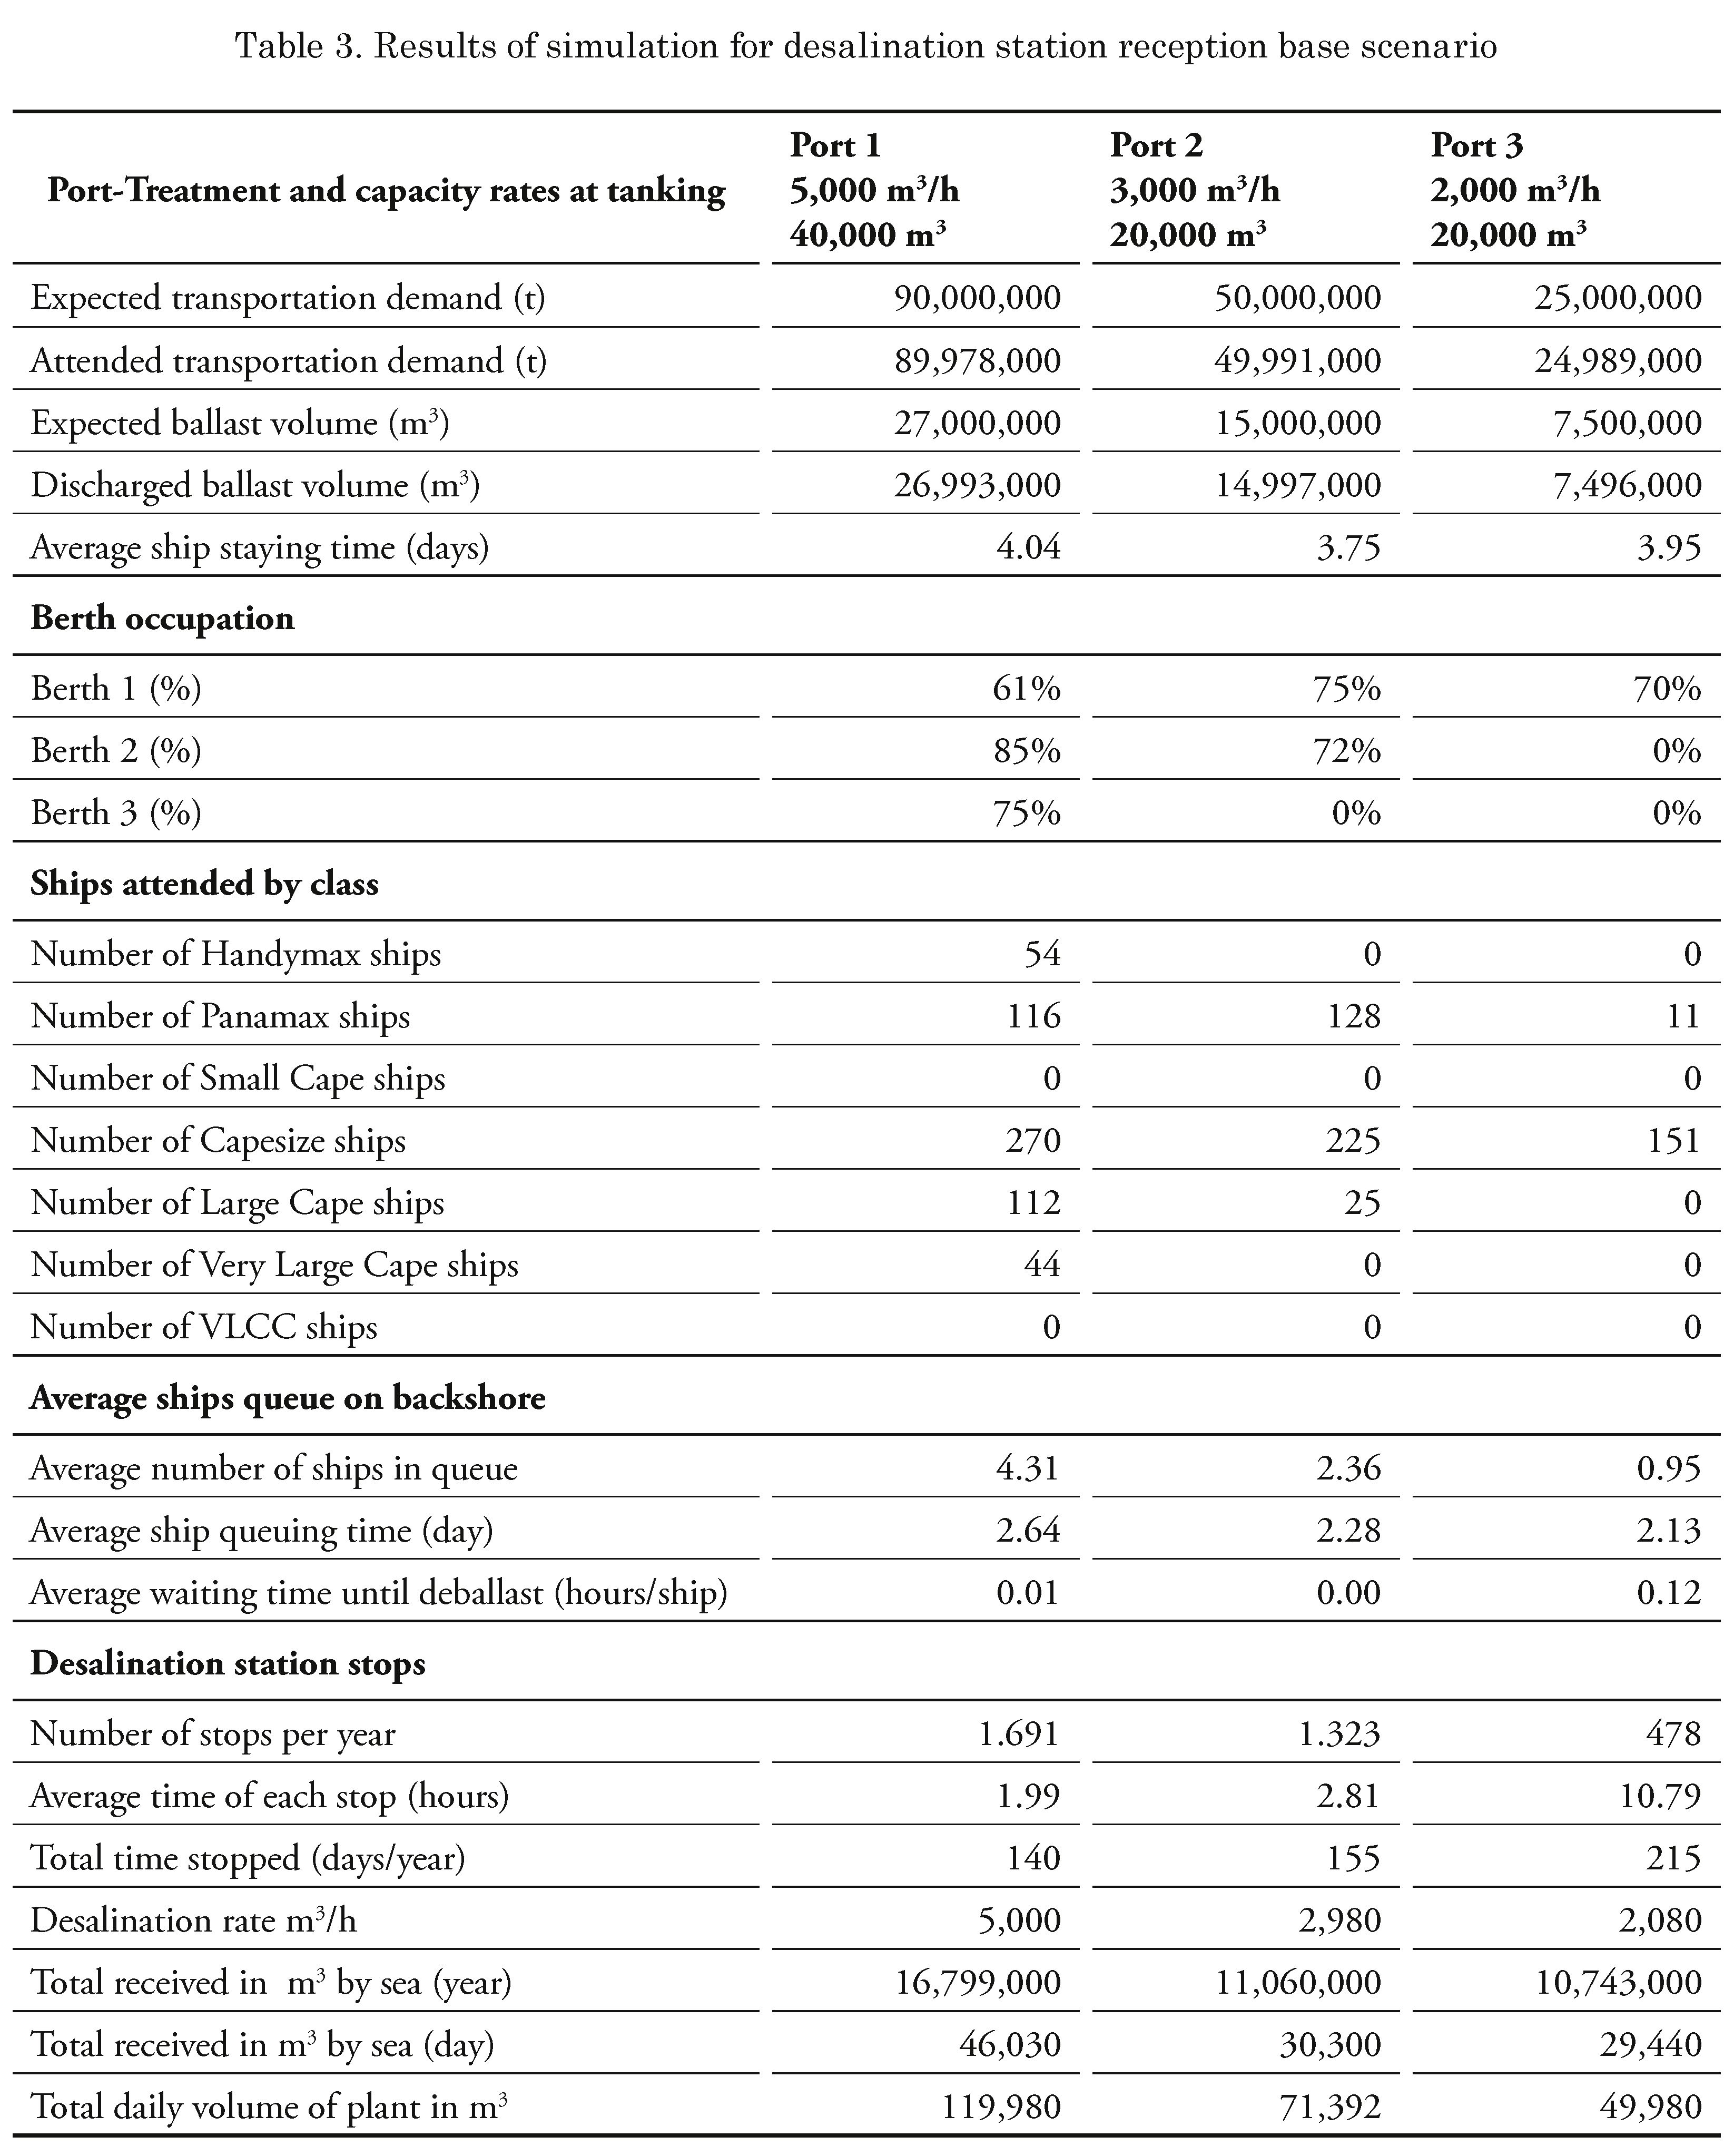
The first simulation was called Base-Alternative, as it refers in itself to the current characteristics of ports. These results follow these criteria: a) to meet the annual transportation demand and ballast water treatment at the lowest tank storage possible, and b) to ensure that occupation rates and queues remain at the same level as the validation condition (Pereira and Brinati, 2012). At the beginning of the simulation, the ballast water receiving tank was considered empty.
The results indicate that the berth occupancy rate and queue time for all ports remained at similar validation degrees. In Ports 1 and 2, there were many stops in the tank pumping system during the year because of the high rate of ballast water transfer, Table 3.
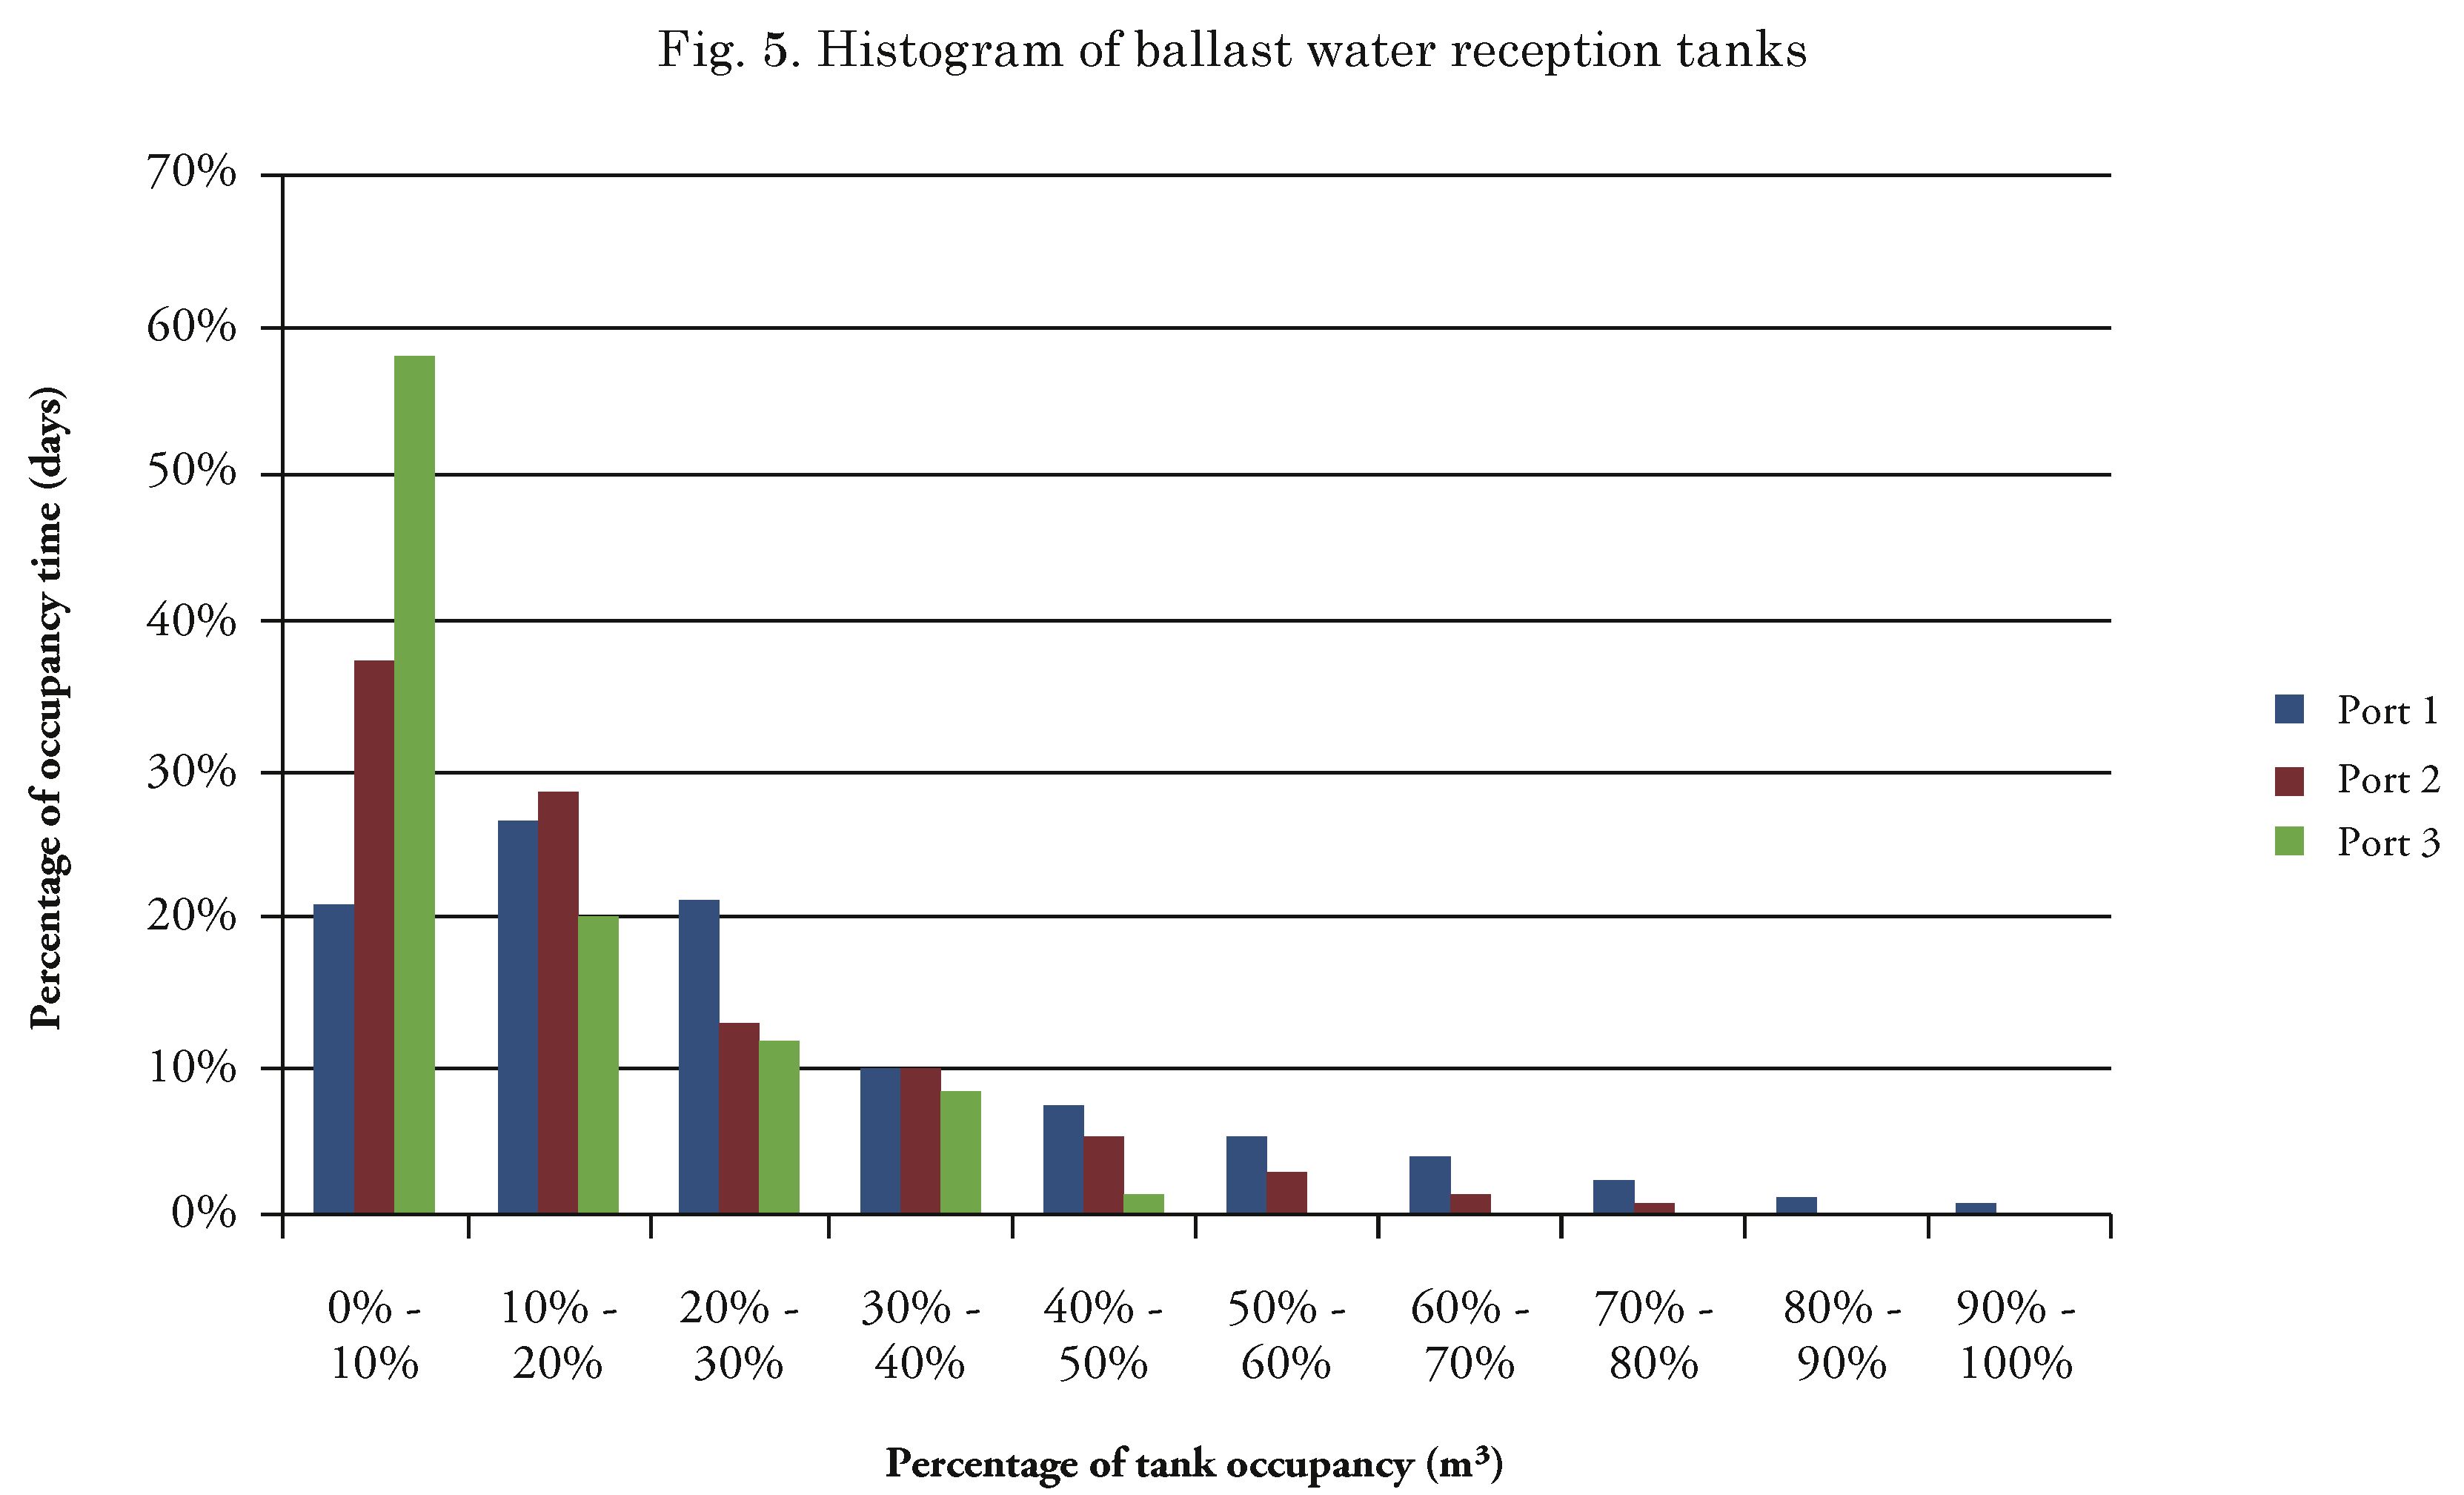
Therefore, the volume of sea water collected is more significant in these alternatives. In this sense, it is important to examine the need of adopting a combined system to capture the water and to guarantee a constant supply to the desalination system. The importance of determining the daily volume of water collected is that this is the parameter used to select the desalination unit to be assembled at a certain location. Fig. 5 presents the history of the ballast water receiving tanks behavior. A restriction was imposed on the model: the exchange of the ocean water capturing system will only be possible when the capacity of the first tank is 50%. Hence, it may be possible to notice that during approximately 2% of the time, the reception tank capacity varied between 90% and 100% of Port 1 capacity Fig. 5.
Fig. 6 shows the mean volume of water delivered to the desalination system, which is composed of the ballast water received and the ocean water captured when the reception tank is empty.
Approximately 37% of the volume received in Port 1 derives from ocean water as there are 4.63 stops per day to supply the tanks. This occurs because the average berth occupancy rate is around 74%. Observing that there are vacant periods during the annual operation, where there are no ships at the port, the system is supplied with ocean water in 37% of the total operation time. The system behavior is analogue to Ports 2 and 3. The ballast water volume received at these ports is lower as well as the berth occupancy rate. Thus, the volume of
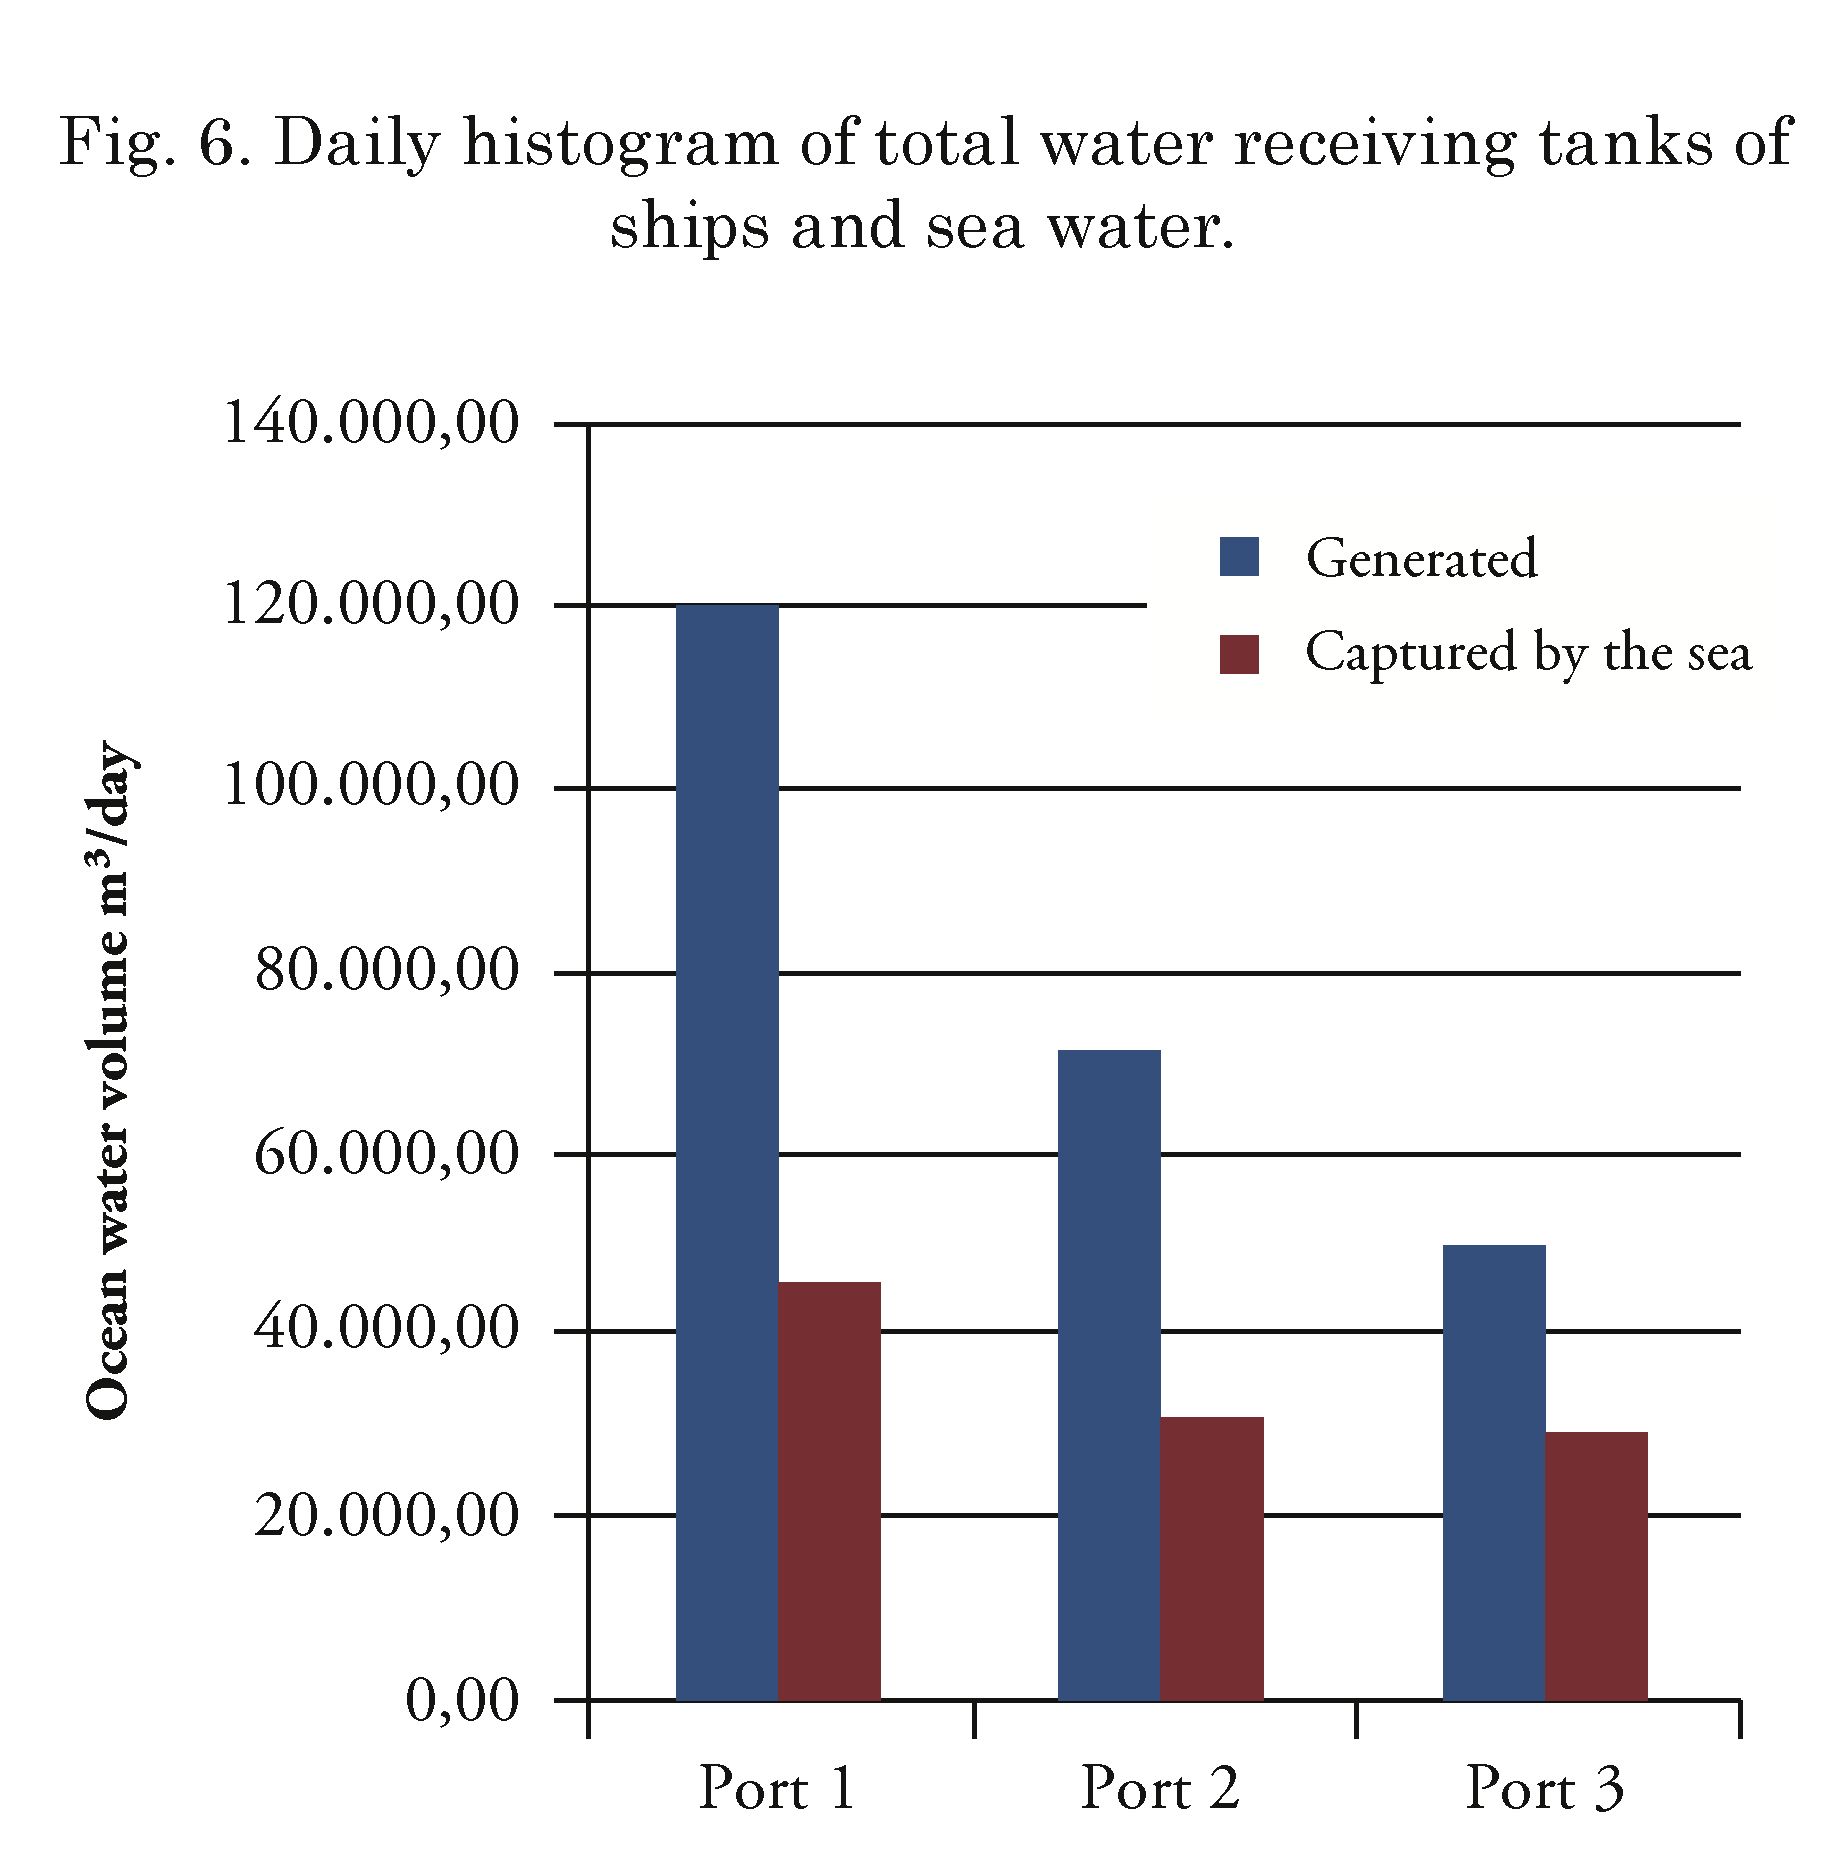
ocean water collected is higher in order to supply the desalination plant.
In all the ports berth occupation and staying time was observed to remain at levels similar to those shown in (Pereira and Brinati, 2012). At Port 1 and 2, a number of tank pumping system stops were verified to occur during the year due the high ballast water transfer rate. The sea water volume collected is more representative in those alternatives. In this case, it is important to verify that it is highly necessary to adopt combined systems for water capturing to guarantee constant supply to the desalination system. The importance of determining the daily water volume collected is that this is the parameter used to select a desalination unit to be assembled at a specific location.
Evaluation of the terminal surrounding areas for installing desalination stations
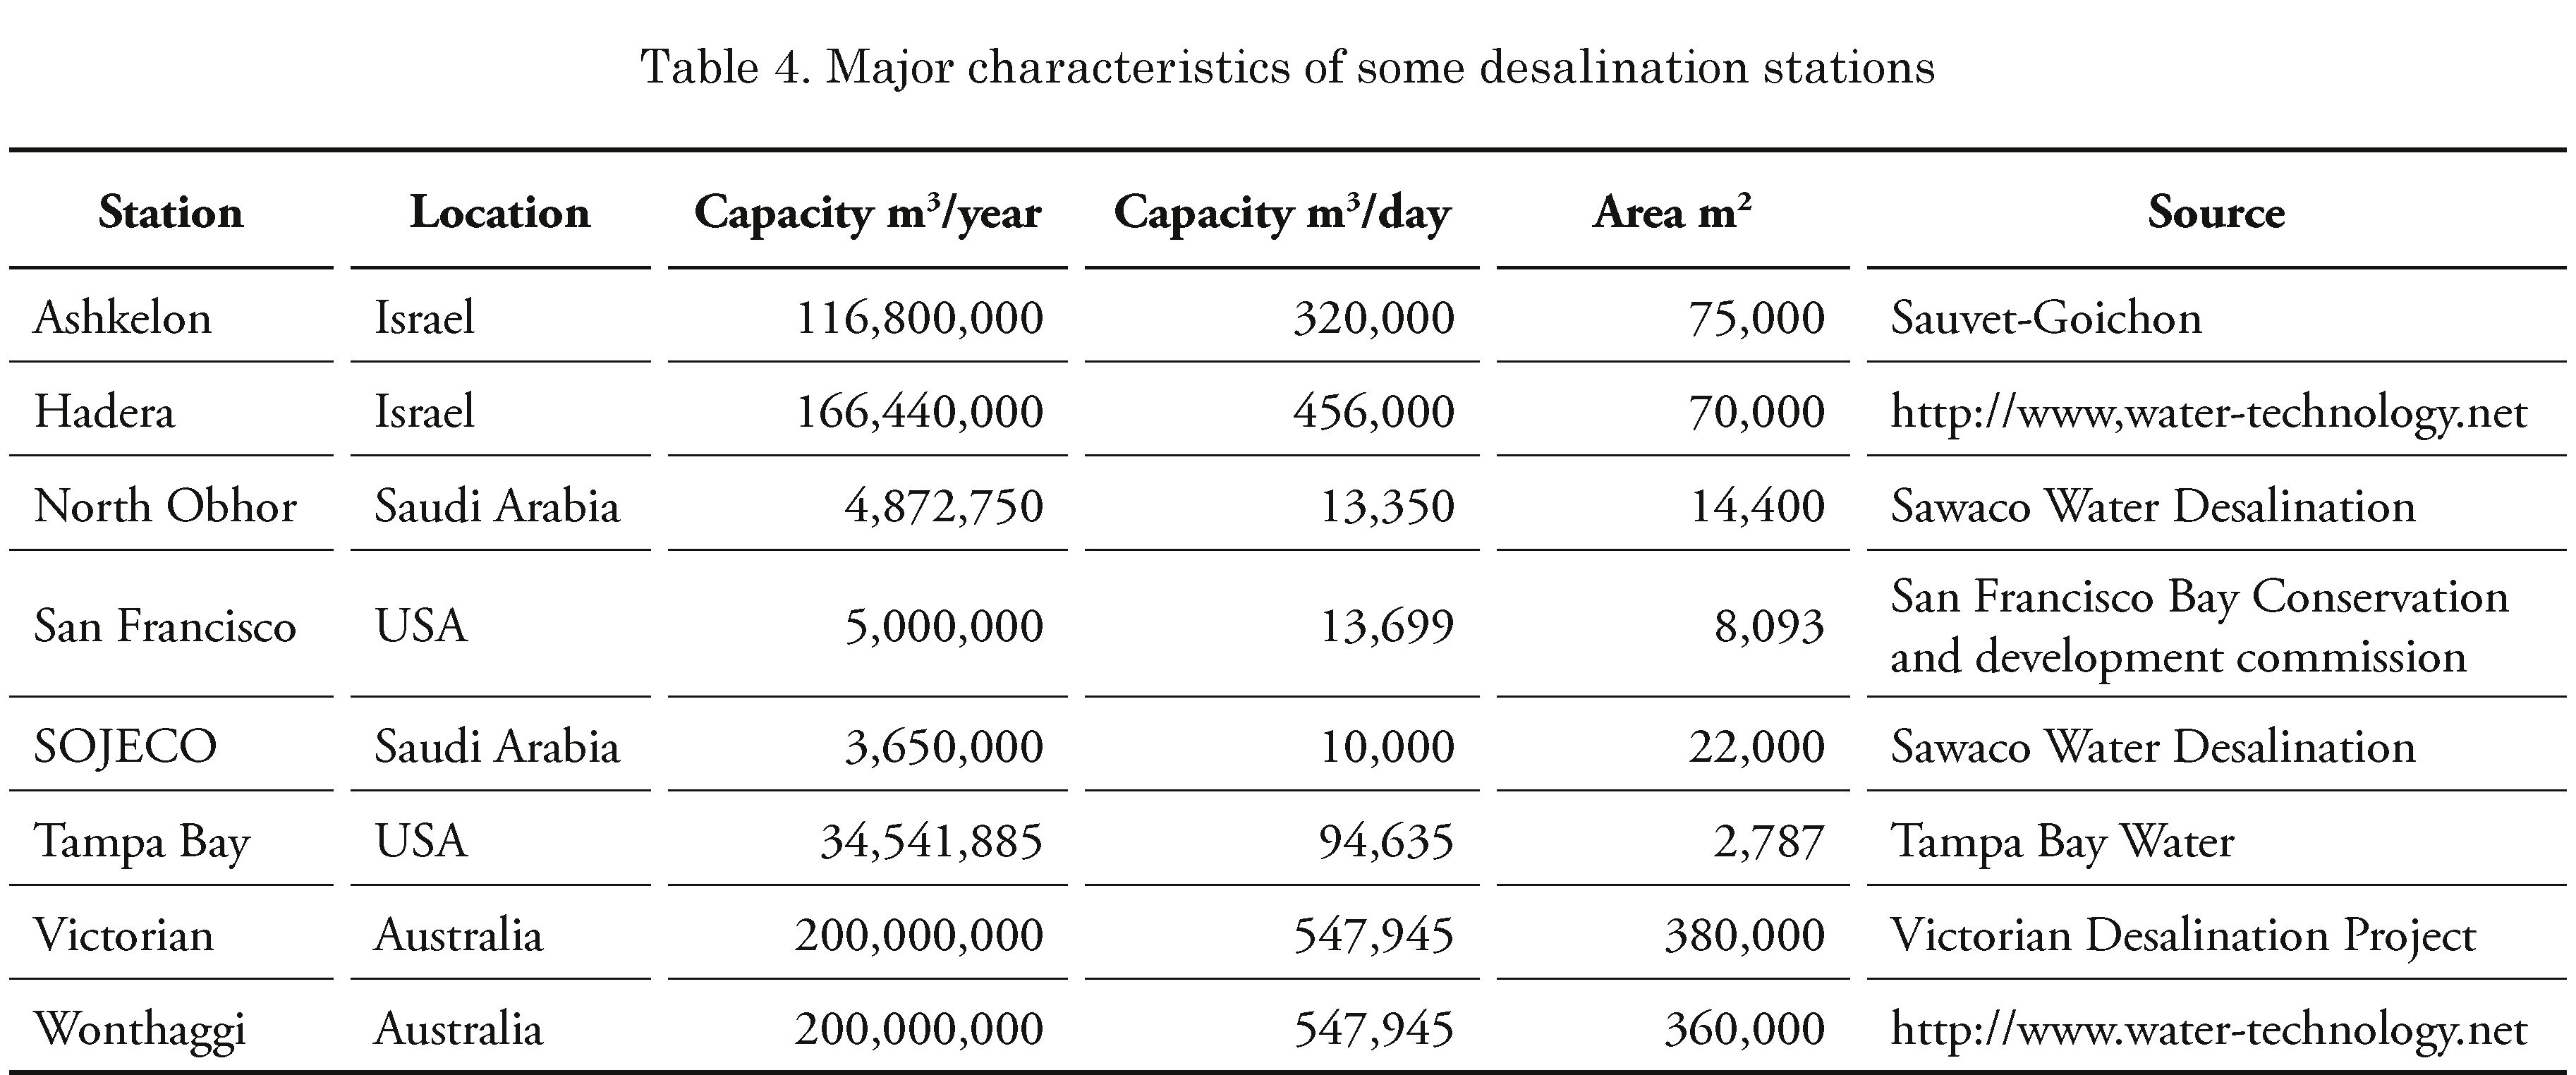
Based on the areas available at the port surroundings, we tried to evaluate if the areas available are sufficient for a desalination system installation that uses reverse osmosis technology. Several studies were consulted providing data of the area occupied by this type of installation that uses the technology proposed for this alternative. Table 4 presents the major characteristics of desalination stations, with special interest in establishing a correlation between station capacities versus occupied area.
Stations that had treatment capacity similar to those defined by the simulation model, were selected. Google Earth was used to verify areas available in those ports surroundings. It is worth noting that there is not a precise correlation between the occupied area versus the desalination station production capacity.
It was observed that all the ports had enough areas to install both reception tanks as well as desalination stations. Note that the use of any alternative energy source that would demand additional areas in the ports surroundings was not considered. Another important point is that there is a significant variation between the areas occupied by desalination stations. Hence, the examples cited are only for reference purposes. It will be necessary to develop a specific project.
Discussion
The results for this alternative show that ballast water treatment in mobile reception unities does not impact the ship loading capacity at ports. All the ships generated during the simulation were attended. Although the average queuing time was higher in comparison to the validation scenario, those results justify themselves by the operational characteristic of the system. The effect on this alternative refers to an increase of stay time of ships in ports.
The major advantage of this system regarding the conventional method of onshore ballast water treatment (Pereira and Brinati, 2012) is its independence from the port. A similar system was studied by (McMullin et al, 2008). Ocean going barges are simpler than ships and might have great ballast water stocking capacity. This alternative was not considered in this paper; however, the necessary stocking capacity might be confronted with the barges capacity to determine the number of barges necessary for treatment. The problem of using barges is that all of them must have on board treatment systems.
On the other hand, this system allows several treatment alternatives to be used inside the receiving vessel. This provides flexibility regarding the operation at the port. Tanker ships no longer in operation could be adapted to provide this service for ports surroundings. This solution also presents the concept of scale economy. As observed, few units would be capable of attending several ships. In terms of capacity and treatment rates, those values are verified to be at offered market system levels. As the treatment system is continuous, there is no loss of time between the reception operation and the start of on board ballast water treatment. Hence, if reception and treatment rates are compatible, downtimes for operations will be minimal.
These types of operations are known by maritime operations as transshipment or ship-to-ship. The system presented in this paper shows nothing different from what already exists in maritime transport operations. Transshipment is highly applicable in iron ore operations and oil transference in open sea.
Also, this option should be faced by ports and shuttle tankers as an opportunity to generate a new service at the ports, such as existing fresh water supply services, bunker, amongst others.
On board BWT systems already installed on ships are under the risk of being replaced due to new restrictions imposed by California (Pereira and Brinati, 2012) (Albert et al. 2013). Those issues could be minimized if those systems were used only at onshore or offshore stations at ports surroundings.
The simulation results indicate that installing a desalination plant does not impact the ship loading capacity at ports. All ships generated by the system were attended. Stoppages in loading due to the deballast system presented times less than 1 hour per ship.
At these ports, both the berth occupation and queue time were verified to remain at degrees similar to those in the data gathered by (.Pereira and Brinati, 2012). Ports 1 and 2 presented many breaks in the tanks pumping system during the year because of the high rate of ballast water transference. The capture of water in the tanks and the ocean has to be combined to guarantee the constant supply of the desalination plant.
These results demonstrate the possibility of assembling a recycling system for the ballast water discharged at the ports to avoid the proliferation of exotic species and vector of diseases at these ports. From a technical stand point, there are no restrictions to this implementation as it might be installed in stages: first, the BWT system eliminates exotic species; and second, a desalination plant might be installed without affecting the port operation.
Installing a desalination plant to treat the ballast water is a rarely explored initiative (Donner, 2010). Onshore ballast water treatment is focused on eliminating exotic species using filtration, UV radiation, hydro cyclone separation, biocides, and other techniques applied to on board treatment in ships and that may be combined. However, these systems do not present efficacy to eliminate 100% of the species present in the ballast water.
Among the current desalination processes, both reverse osmosis and thermal process proved to be the most efficient solutions for ballast water. In reverse osmosis, water is projected to a membrane where the separation of water and salt occurs. This process uses micro membranes up to 0.2-pm of thickness which are capable of filtering microalgae such as (Castaing, 2010). After the desalination process, the water undergoes treatment for chemical and micro biotic stabilization, palatability and pH correction. The current standard recommended by IMO-D2 is <10 organisms per cubic meter greater than 50 pm (David and Gollasch, 2014). The standard established by California Law does not allow organisms greater than 50 pm. For organisms between 10 and 50 pm it cannot not be more than 0.01/ml (Dobroski, et al, 2011).
Desalination through distillation via multiple-effect distillation (MED), multi-stage flash distillation (MSF) and vapor compression (VC) consists in heating the water until its ebullition temperature. Among the alternatives to treat ballast water, there is the proposition of using the heat lost in the ships’ propulsion to heat the ballast water. To eliminate organisms, ballast water has to be heated to temperatures varying between 35° and 80° (Gregg et al. 2009) (Quilez-Badia et al. 2008), and kept heated until the organisms are eliminated. Thus, the thermal process tends to guarantee the complete elimination of organisms present in the ballast water.
Ballast water desalination may generate a new business in ports that receive high volumes of ballast water. On the verge of lack of fresh water in many parts of the world, this alternative should not be rejected to those who manage and invest in ports operations.
In the ports evaluated for this paper there are areas available for building a desalination plant. e advantage of installing a desalination plant is that it does not need to be constructed near the port, favoring highly dense ports.
The ballast water management alternatives presented in this article might be installed at ports. Among the three alternatives (1) (Pereira and Brinati, 2012% (2) and (3) for ballast water management and treatment, option (2) was identified as the option that does not impact the port structure. However, an increase in ships stay time at the port was verified if compared to the two alternatives in land. In these simulations, this increase of time did not rule out operations at terminals and we determined a minimal number of shuttle ships to attend the transport demand. If we increase the number of shuttle ships, this time may reduce; however, these ships might present low occupation rate. Considering that iron ore ports in Brazil presents elevate high number of ship waiting in queue, this effect might be dissipated during port operations. Hence, while a ship waits, treatment is provided.
Treating ballast water in a desalination plant (3) also appears to be an alternative to be assembled at port areas. However, it is necessary to build it next to or far from the port structures to provide this treatment. As this alternative was less explored in the literature for this matter, this study opens the opportunity for new researches to be conducted and to determine its viability of eliminating exotic species, as well as an economic evaluation.
This study was financed and supported by the Brazilian National Council of Scientific and Technological Development— CNPq. We thank our colleagues from the Innovation Center for Logistics and Ports Infrastructure for reading and criticizing the first draft.
Ahmed, Mushtaque, Walid H. Shayya, David Hoey, and Juma Al-Handaly. “Brine Disposal from Reverse Osmosis Desalination Plants in Oman and the United Arab Emirates.” Desalination 133, no. 2 (March 2001): 135-147. doi:10.10l6/s0011-9164(01)80004-7.
Albert, R. J., Lishman, J. M., & Saxena, J. R., “Ballast water regulations and the move toward concentration-based numeric discharge limits,” Ecological Applications, 2013, 23(2), 289-300. http://doi.org/10.1890/12-0669.1
Albert, R. J., Lishman, J. M., & Saxena, J. R., “Ballast water regulations and the move toward concentration-based numeric discharge limits,” Ecological Applications, 2013, 23(2), 289-300. http://doi.org/10.1890/12-0669.1
Çakmakce, Mehmet, Necati Kayaalp, and Ismail Koyuncu “Desalination of Produced Water from Oil Production Fields by Membrane Processes,” Desalination, Vol. 222, no. 1-3 (March 2008): 176-186. doi:10.10l6/j.desal.2007.01.147.
Cariton, J. T., andj. B. Geller, “Ecological Roulette: The Global Transport of Nonindigenous Marine Organisms.” Science, Vol. 261, no. 5117 (July 2, 1993): 78-82. doi:10.1126/science.26l.5117.78.
Castaing, J.-B., A. Massé, M. Pontié, V. Séchet, J. Haure, and P. Jaouen, “Investigating Submerged Ultrafiltration (UF) and Microfiltration (MF) Membranes for Seawater Pre-Treatment Dedicated to Total Removal of Undesirable Micro-Algae,” Desalination, Vol. 253, no. 1-3 (April 2010): 71-77. doi:10.10l6/j.desal.2009.11.031.
Cohen, A. N. (2015), “Test programs for treatment of ballast water discharges need transparency and better science” Integr Environ Assess Manag> 11: 719-721. doi: 10.1002/ieam.l684
Cohen, A. N., & Dobbs, F. C., “Failure of the public health testing program for ballast water treatment systems,” Marine Pollution Bulletin, 2015, 91(1), 29-34. http://doi.0rg/lO.lOl6/j.marpolbul.2014.12.031
David, M.; Gollasch, S., “Global Maritime Transport and Ballast Water Management: Issues and Solutions, Invading Nature,” Springer Series in Invasion Ecology 8; Springer Science + Business Media.Dordrecht, The Netherlands, 2015.
Donner, P., “Ballast water treatment ashore brings more benefits, 97-105,” WMU Journal of Maritime Affairs, October 2010, Volume 9, Issue 2, pp 191-199. http://dx.doi.org/lO.lOO7/bfO3i95i74
Gollasch, Stephan, Matej David, Matthias Voigt, Egil Dragsund, Chad Hewitt, and Yasuwo Fukuyo, “Critical Review of the I MO International Convention on the Management of Ships’ Ballast Water and Sediments,” Harmful Algae, Vol. 6, no. 4 (August 2007): 585-600. doi:10.10l6/j. hal.2006.12.009.
Gollasch, S, “A new ballast water sampling device for sampling organisms above 50 micron,” Aquatic Invasions, 2006, 1(1), 46-50.
Gregg, M., Rigby, R., &C Hallegraeff, G, “Review of two decades of progress in the development of management options for reducing or eradicating phytoplankton, zooplankton and bacteria in ship’s ballast water,” Aquatic Invasions, 2009, 4(3), 521— 565. http://doi.Org/10.3391/ai.2009.4.3.l4
Gregg, M., Rigby, R., & Hallegraeff, G., “Review of two decades of progress in the development of management options for reducing or eradicating phytoplankton, zooplankton and bacteria in ship’s ballast water,” Aquatic Invasions, 2009, 4(3), 521-565. http://doi.Org/10.3391/ai.2009.4.3.l4
Hallegraeff, G. M., “Harmful algal blooms in the Australian region,” Marine Pollution Bulletin, 1992, 186-190.
Jing, Liang, Bing Chen, Baiyu Zhang, and Hongxuan Peng, “A Review of Ballast Water
References
our colleagues from the Innovation Center for Logistics and Ports Infrastructure for reading and criticizing the first draft.
Management Practices and Challenges in Harsh and Arctic Environments,” Environmental Reviews 20, no. 2 (June 2012): 83-108. doi:10.1139/a2012-002.
King, D.M., Hagan, P.T., Riggio, M., Wright, D.A., “Preview of global ballast water treatment markets,” Journal of Marine Engineering & Technology, 2012 11(1), 3-15.
Liu, S., Zhang, M., Li, X., Tang, X., Zhang, L., Zhu, Y., &c Yuan, C., “Technical feasibility study of an onshore ballast water treatment system,” Frontiers of Environmental Science & Engineering in China, 2011,5(4), 610-614. http://doi.org/10.1007/si1783-011-0379-2
McMullin, J., et al., "Port of Milwaukee Onshore Ballast Water Treatment," Proceedings of the Water Environment Federation 2008.8 (2008): 7464-7480.
Minton MS, Verling E, M. A., Ruiz, G. M., “Reducing propagule supply and coastal invasions via ships: effects of emerging strategies,” Front Ecol Environ, 304-308.
Pereira, N. N., 2012, Ballast water treatment alternatives for iron ore exporting ports, Thesis from Universidade de São Paulo. Available from: http://www.teses.usp.br (in Portuguese)
Pereira, N., Brinati, H.L., “Onshore ballast water treatment: A viable option for major ports,” Marine Pollution Bulletin.
Quilez-Badia, G., McCollin, T, Josefsen, K. D., Vourdachas, A., Gill, M. E., Mesbahi, E., Frid, C. L. J., “On board short-time high temperature heat treatment of ballast water: a field trial under operational conditions,” Marine Pollution Bulletin, Jan. 2008, 127-35.
Ship Science & Technology - Vol. 10 - n.° 20 - (41-57) January 2017 - Cartagena (Colombia) 57