
Ship Science &Technology - Vol. 16 - n.° 32 - (43-54) January 2023 - Cartagena (Colombia)
DOI: https://doi.org/10.25043/19098642.135
Katherine álvarez Castillo1
José M. Ahumada2
Cristian Cifuentes3
Gonzalo Tampier4
Álvaro Gallardo5
1 Universidad Austral de Chile. Instituto de Ciencias Navales y Marítimas. Valdivia, Chile. Email: katherine.alvarez01@alumnos.uach.cl
2 Universidad Austral de Chile. Instituto de Ciencias Navales y Marítimas. Valdivia, Chile. Email: jose.ahumada@uach.cl
3 Universidad Austral de Chile. Instituto de Ciencias Navales y Marítimas. Valdivia, Chile. Email: cristiancifuentes@uach.cl
4Universidad Austral de Chile. Instituto de Ciencias Navales y Marítimas. Valdivia, Chile. Email: gonzalo.tampier@uach.cl
5Centro Tecnológico MERIC (Marine Energy Research &Innovation Center). Email: alvaro.gallardo@meric.cl
Date Received: November 23th, 2022 - Fecha de recepción: 23 de noviembre de 2022
Date Accepted: January 20th, 2023 - Fecha de aceptación: 20 de enero de 2023
The goal of this study is to analyze the hydrodynamic behavior of a Floating Wind Platform (FOWT) under regular wave conditions. The analysis considers three degrees of freedom: Heave, Pitch and Surge. The study was carried out using a CFD (Computational Fluid Dynamics) tool, based on the Navier-Stokes equations and the Finite Volume Method, and results were compared against experimental tests performed at the Wave/Towing Tank at Universidad Austral de Chile (CEH-UACh). For this analysis, a generic scales semi-submersible platform was used under different regular wave conditions, obtaining wave height data at different points of the control volume and translation and rotation movements to obtain the RAO's (Response Amplitude Operator) in each of the considered degrees of freedom. For the CFD simulations, commercial software STAR CCM+ was used, where the flow characteristics were defined through Volume of Fluid (VOF) and their respective boundary conditions. Finally, the results of both methodologies were compared, showing an adequate degree of correlation between them.
Key words: Floating Wind Platform, RAO, CFD, Regular Wave, Potential Wave, Control Volume, DFBI.
El objetivo de este estudio es el análisis del comportamiento hidrodinámico de una Plataforma Eólica Flotante (FOWT) bajo oleaje regular. El análisis considera tres grados de libertad: Heave, Pitch y Surge. El estudio se ha realizado mediante una herramienta CFD (Computational Fluid Dynamics), basada en las ecuaciones de Navier-Stokes y el Método de los Volúmenes Finitos, y los resultados se han comparado con ensayos experimentales realizados en el Canal de Ensayos Hidrodinámicos de la Universidad Austral de Chile (CEH-UACh). Para este análisis se utilizó una plataforma semi-sumergible genérica a escala bajo diferentes condiciones de oleaje regular, obteniendo datos de altura de ola en diferentes puntos del volumen de control y movimientos de traslación y rotación para obtener los RAO's (Response Amplitude Operator) en cada uno de los grados de libertad considerados. Para las simulaciones CFD se utiliza el software comercial STAR CCM+, donde las características del flujo se definen a través del Volumen de Fluido (VOF) y sus respectivas condiciones de contorno. Finalmente, se comparan los resultados de ambas metodologías, mostrando un adecuado grado de correlación entre ellas.
Palabras claves: Plataforma eólica flotante, RAO, CFD, Olas regulares, Volumen de Control, DFBI.
It is well known that energy demand has been growing year after year worldwide due, among other things, human overpopulation, and the development of new and increasingly complex technologies that require more energy. However, the supply of resources, especially conventional energy resources such as fossil fuels, is limited and their decrease is evident when projected for the coming decades. Therefore, it has become necessary to develop technologies and devices that produce energy based on natural, renewable and/ or perennial resources, such as photovoltaic, wind, wave, and tidal energy, among others.
As far as renewable energies are concerned, in 2019 a maximum installed capacity of 2,537 GW was achieved worldwide [1], with the onshore wind and photovoltaic industries currently leading the way with capacities of 621 and 509.3 GW respectively [2,3]. However, the offshore wind power (FOWT) industry has undergone significant development in recent years, reaching an installed capacity of approximately 30 GW [4], of which 75% is installed in Europe and 23% in China, the main actors in the field [2].
The first FOWT project materialized at full scale is the HyWind Scotland floating wind farm, which has been operating since 2017 and has 5 spar turbines of 253 m height, projected to power 200,000 homes in the United Kingdom [5]. On the other hand, China recently installed its first deep water floating wind turbine called Fuyao, which has a total height of about 72 m equipped with a 6.2 MW anti-typhoon wind turbine. In Latin America, although there are no FOWTs installed, there are onshore wind farms. Countries such as Brazil, Chile and Uruguay stand out as world leaders in wind energy generation, accumulating a power of 8,715 MW, 933 MW and 845 MW respectively [6]. In addition, there is a great investment interest in FOWT in countries such as Colombia [8,9], Brazil [10,11] and Chile [12,13].
Chile has a rather peculiar scenario: in 2021, for the second consecutive year, it was the first country in Latin America to deplete its natural resources, exhausting them only in the month of May [13]. For this reason, the Chilean government and the Ministry of Energy have established through Law 20.698 that 20% of the country's energy must come from renewable sources by 2025 and 70% by 2050 [14]. Such a goal is not unattainable for Chile, the most attractive country for clean energy development followed by India, China, and Colombia [15]. In fact, some of the renewable sources in Chile are estimated to be able to generate between 27 and 103 kW/m for marine energy, 131 GW for fixed offshore wind turbines and 826 GW for floating wind turbines (see Fig. 1) [16].
Fig. 1. Offshore wind energy potential off the Chilean coast [16].
Within this context, Chile has been increasing the production of renewable energies, reaching in 2021 to obtain 24% of photovoltaic energy and 17% of wind energy (among others) [17] (both with respect to the total energy produced) and, in 2022, for the first time the generation of renewable energies (27.5%) exceeds the generation of coalbased energy (26.5%)[18].
Even though Chile has the great potential and availability of resources described above, the development of FOWT is still in an (increasingly) prospective stage. Therefore, the environmental urgency, the limited availability of conventional energy resources and the usable offshore wind capacity in the country's ocean is what motivates this analysis of a FOWT, as well as the validation of a commercial CFD (Computational Fluid Dynamic) tool, a technique that has gained relevance in recent years due to the possibility of solving the fluid-structure interaction, including viscous effects and nonlinear phenomena.
A FOWT is a simple floating structure with a floater, which is connected to the seabed through the mooring lines with their respective anchoring system. It is coupled to a mast that at its upper point supports the rotor with (usually) 3 blades that rotate when receiving the wind speed, producing the energy (see Fig. 2).
Fig. 2. Parts of a FOWT and the loads it receives [19].
As can be seen in Fig. 2, the wind that hits the turbine not only generates energy, but also, when interacting with the blades, induces aerodynamic loads that destabilize the turbine, causing it to lose its verticality. This, added to the hydrodynamic forces produced by the action of waves and currents, requires a carefully determined float-mooring-anchor configuration to counteract these loads and achieve system stability. In this sense, FOWTs can be classified into 3 main types (see Fig. 3):
Fig. 3. FOWT types [23].
Spar Buoy. This type of platform is characterized by having a deep draft, which can be stabilized by means of ballast at the bottom of its structure, causing the center of gravity to be below its center of buoyancy. An example of this type is the previously mentioned HyWind Scotland floating wind farm [20].
Semi-submersible. This system is characterized by having a larger buoyancy plane, causing the center of gravity to be above its center of buoyancy, and can be stabilized by buoyancy. Currently, one such full-scale platform is the WindFloat: developed by Principal Power, it already has an installed capacity of 75 MW [21].
Tension-Leg Platform (TLP). This type of platform is represented has a larger buoyancy/ displacement ratio, being stabilized by its highly tensioned tendons. An example of this type of system is the PelaStar TM technology developed by Glosten [22].
In CFD, the system of Navier-Stokes equations including the continuity equation in threedimensional space is used to describe the behavior of incompressible Newtonian fluids.

On the other hand, regular wave simulations are initialized from the linear theory. In this theory, to simplify the equation governing the flow, when characterizing the field in the control volume, it assumes that the flow complies with the Potential Flow Theory. That is: a flow without viscosity (no shear stresses), irrotational and incompressible (constant density) that meets the following boundary conditions:
Applying the above, the flow behavior reduces to the Laplace (2) and Bernoulli (3) equations:


where φ is the flow velocity potential, ρ is the flow density, p is the flow pressure, p0 is the atmospheric pressure and z is the depth. By solving those equations for potential, it is possible to describe a regular wave with parameters such as period (T), wavelength (λ), water depth (h), height (H) and amplitude (ζ) (see Fig. 4).
Fig. 4. Regular wave definitions [24].
When a floating body interacts with a regular wave train, the latter induces oscillatory motions in the body, which are produced by hydrodynamic forces including inertial, damping, restoring and external forces. These motions are defined, according to their type of oscillation (Surge, Sway, Heave, Roll, Pitch or Yaw) through the Response Amplitude Operator (RAO), which is a ratio between the maximum amplitude of the object motion (s0) and the maximum amplitude of the incident regular wave (η0).

Let s be the amplitude of motion at each degree of freedom, the equation defining the motion of the floating body interacting with a wave train is:

where m is the mass of the body, A is the added mass, B is the damping coefficient, C is the restoration coefficient and Fext is the external excitation force interacting with the body.
A generic floating wind platform is simulated, at scale size, in the STAR CCM+ software. Fig. 5 shows the model designed by using Rhinoceros software where the 3 cylindrical floats, mooring points, deck, and the wind turbine mast can be distinguished. The main characteristics of the platform are shown in Table 1. The simulation reproduces the experimental tests carried out with this platform at the Wave/Towing Tank at Universidad Austral de Chile (CEH-UACh). The tank’s main dimensions for LxBxT = 45x3x2 meters equipped with an irregular wave generator is capable of generating regular waves of up to 0.2 m in height.
Fig. 5. Rhinoceros modeling of the generic semisubmersible platform.

Fig. 6 shows the configuration of the problem and the dimensions of the control volume. A control volume of dimensions LxBxD = 8x3x3 meters and a depth of 1.73 meters is considered. In addition, the position of each floater on the platform, of the 4 wave sensors and of the 3 mooring lines can be seen. It should be noted that for the numerical simulation, the wave generator (flow inlet) is defined to be 3 meters away from the longitudinal center of the platform. This configuration is subjected to 5 wave conditions shown in Table 2.
Fig. 6. Configuration of the numerical set-up.

Fig. 7 shows the geometry previously designed in Rhinoceros and imported into STAR CCM+ as a "Surface Mesh" of maximum dimensions LxBxD = 8x1.5x3 meters where only half of the geometry is considered to reduce the calculation time thanks to the existing symmetry in the problem. Then, different regions of the geometry are delimited to make explicit the behavior of the different materials considered in the "Multiphase" model: water and air with their respective constant densities of 997.561 and 1.184 [kg/m3]. The multiphase model defines the interaction of two flows in contact and these, in turn, are coupled using the "Volume Fraction" method to calculate the vertical position of the free surface.
Fig. 7. Geometry and regions of the Control Volume in STAR CCM+.
The defined regions are:
A few other models applied in the STAR CCM+ simulation are shown in Table 3.
Table 3. Boundary conditions for each surface and physical models.
Two mesh configurations are studied to solve the problem (see Fig. 8). The first mesh corresponds to the "Channel" control volume and the other to the "Overset" control volume. The Surface Meshers tool is used in both, which allows a re-meshing of the surface to be better adapted to the post-meshing of the volume with the Trimmed Cell Mesher tool. The "Channel" mesh contains a 50% refinement in a volumetric control around the free surface and the "Overset" mesh has a 50% surface refinement on the walls of the platform.
Fig. 8. Three-dimensional meshing of the problem in STAR CCM.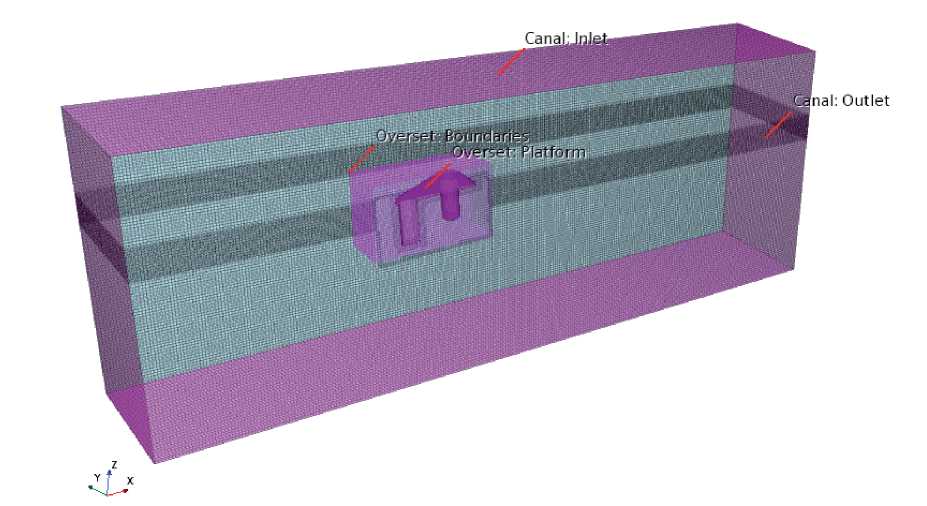
The DFBI Rotation and Translation module is defined to simulate the motion of the floating body in interaction with the VoF (Volume of Fluid), solving the forces and moments acting on the body finding solutions to the equations of motion (5). For this, other bodies coupled to the platform that generate external forces on it must be defined. In this case the 3 mooring lines (see Fig. 6) with their respective positions and elastic properties are considered.
In this module the platform is specified as a 6-DOF Body (6 Degrees of Freedom Body) and its properties (mass, center of mass, moments of inertia, velocity) are identified. For this case, the motion of the body is restricted to 3 degrees of freedom: translation in the X-axis, translation in the Z-axis and rotation with respect to the Y-axis.
The results of a first approach to the problem using CFD are shown below. Fig. 9 shows a plot of frequency [rad/s] vs maximum wave amplitude [mm], where the results of wave sensors 1, 2 and 3 are shown. The purpose of this plot is to compare the numerical and experimental results, both with respect to the theoretical input. It is important to mention that the results shown in Fig. 9 represent the wave tests without platform, to avoid interference of the model with the wave train, which would cause alterations in the measured data.
Fig. 9. Comparison between theoretical wave height, experimental sensor measurement and CFD sensor measurement, all without models.
The image shows that the better correlated CFD results (compared to the theoretical input) are obtained for sensor 3, which seems adequate since, being at the flow inlet, there is no numerical diffusion along the spatial domain. Even so, it does differ by a percentage (4-10%) and this could be caused by a lack of precision in the parameters used for the meshing of the problem.
During this research, it became evident that one of the major problems of this type of simulations, which considers wave propagation, is the reflection in the outflow boundary condition. One of the solutions to this problem is to include an artificial dissipation zone in the downstream zone located far from the platform, so as not to interfere with its motion. In the results, when comparing the downstream sensors, it is clearly observed that the numerical results underestimate the wave amplitudes (sensor 4 CFD rhombus magenta), because this zone is governed by an artificial dissipation imposed on the output of the computational domain with the objective of decreasing or eliminating the wave reflection. The artificial dissipation factor is a function of the wavelength, and during the present work it was approximately 2 times the wavelength.
Comparing the amplitudes obtained by CFD as a function offrequency it is possible to observe that the influence of dissipation increases as the frequency increases, this flow behavior could also be because the mesh element size has an increase relative to the wave lengths, producing an additional numerical dissipation due to the convective propagation of the wave. It is worth mentioning that, although the simulations were performed with a higher order upwind scheme, inherently the convective physical processes discretized by this method produce numerical dissipation.
In this project, the appropriate value of the artificial dissipation parameter as a function of frequency is still under investigation.
As for the RAOs of the different motions, Figs. 10, 11 and 12 show plots of frequency [rad/s] vs Response Amplitude [-] of the Surge, Heave and Pitch motions, respectively. In this case the objective is to compare the results obtained numerically and experimentally.
Fig. 10. Experimental and numerical surge RAO.


From this, there is a greater deviation of the results for the natural frequency zone, i.e., environment of ω=4.22 [rad/s] in the surge, heave, and pitch motions. However, a clear trend to the empirical results is identified, especially for the higher frequencies. From the plots it is evident that the amplitude of the motion of a floating body is proportional to the amplitude of the wave with which it interacts.
Particularly for the Pitch RAO, there is an outlier at ω=4.22 [rad/s], which error exceeds 200%. Since all simulations are identical and only VoF varies, a mesh refinement should be performed and control volume must be extended until a damping zone away from all study points is obtained, i.e., away even from sensor 4. This will improve not only the results of sensor 4 but will also affect the results of the platform motions, expecting more accurate values with respect to the experimental data.
Finally, from the RAO's it can be deduced that the platform does not present major problems when looking for hydrodynamic stability. This is due to the considerable size of the water plane area, as described in section 2.1.
In Chile, floating wind energy devices are in an early stage of research. Therefore, when testing new devices, it is important to obtain support of results through different methodologies (experimental and numerical) to ensure the accuracy of the solutions. In this context, a comparison of experimental results (CEH-UACh) versus CFD results of the same configuration for 4 different regular wave conditions is presented.
The data obtained comply graphically with the trend of the experimental results and the values are close. However, considering the error ranges in the results for both wave amplitude and RAO's (especially those for frequency ω=4.22 [rad/s] that are more than twice), the simulation does not turn out to be satisfactory. Therefore, as a future work, a parametric analysis of the mesh is proposed to improve the accuracy of the results and, thus, give way to the analysis in irregular waves, which is the final objective of the project.
[1] V. HERTZSCH, “Experimental Analysis of Motions and Loads for a Floating Offshore Wind Platform in Waves,” Technische Universitat Berlin, 2020.
[2] J. LEE AND F. ZHAO, “GWEC Global Wind Report 2019,” 2020.
[3] M. SCHMELA, R. ROSSI, A. BEAUVAIS, N. CHAVILLARD, M. G. PAREDES, AND M. HEISZ, “Global Market Outlook For Solar Power 2019-2023,” 2019.
[4] International Renewable Energy Agency, “Renewable Capacity Statistic 2020,” 2020.
[5] A. JACOBSEN AND M. GODVIK, “Influence of wakes and atmospheric stability on the floater responses of the Hywind Scotland wind turbines,” Wind Energy, 2020.
[6] Global Wind Energy Council, “Brasil, Chile y Uruguay lideran energía eólica,” 2022. https://gwec.net/brasil-chile-y-uruguay-lideran-energia-eolica/
[7] J. G. RUEDA-BAYONA, A. GUZMáN, J. J. CABELLO ERAS, R. SILVA-CASARÍN, E. BASTIDAS-ARTEAGA, AND J. HORRILLO=CARABALLO, “Renewables energies in Colombia and the opportunity for the offshore wind technology,” J. Clean. Prod., vol. 220, pp. 529-543, 2019, doi: https://doi.org/10.1016/j.jclepro.2019.02.174.
[8] J. G. RUEDA-BAYONA, A. GUZMÁN, AND J. J. CABELLO ERAS, “Wind and power density data of strategic offshore locations in the Colombian Caribbean coast,” Data Br., vol. 27, 2019, doi: https://doi.org/10.1016/j.dib.2019.104720.
[9] L. F. DE ASIS TAVARES, M. SHADMAN, L. P. DE FREITAS ASSAD, C. SILVA, L. LANDAU, AND S. ESTEFEN, “Assessment of the offshore wind technical potential for the Brazilian Southeast and South regions,” Energy, vol. 196, 2020, doi: https://doi.org/10.1016/j.energy.2020.117097.
[10] M. SANTANNA, J. M. FAULSTICH, V. APARECIDA, AND A. NUNES, “Proposal of a methodology to use offshore wind energy on the southeast coast of Brazil,” Energy, vol. 185, pp. 327-336, 2019, doi: 10.1016/j.energy.2019.07.
[11] C. MATTAR AND M. C. GUZMÁN, “A techno-economic assessment of offshore wind energy in Chile,” Energy, vol. 133, pp. 191-205, 2017, doi: https://doi.org/10.1016/j. energy.2017.05.099.
[12] C. MATTAR AND N. VILLAR, “Estimación del potencial eólico offshore en las costas de Chile utilizando datos de escaterómetro y Reanalysis,” Rev. Teledetección, pp. 49-58, 2014.
[13] Center for Climate and Resilience Research, “Chile fue el primer país de América Latina en agotar todos sus recursos naturales del 2021,” 2021. https://www.cr2.cl/chile-fue-el-primer-pais-de-america-latina-en-agotar-todos-sus-recursos-naturales-del-2021-anadolu-agency/.
[14] Ministerio de Energía, Energía 2050 Política Energética de Chile, 2da ed. 2017.
[15] Climatescope, “Climatescope’s ranking of the most attractive markets for renewable energy projects investment.,” 2022. https://global-climatescope.org/results/.
[16] World Bank Group, “Offshore Wind Technical Potential in Chile,” 2020.
[17] C. MATTAR, F. CABELO-ESPAÑN, AND N. ALONSO-DE-LINAJE, “Towards a Future Scenario for Offshore Wind Energy in Chile: Breaking the Paradigm,” Sustainability, vol. 13, 2021.
[18] El Mostrador, “Chile da un paso firme en sustentabilidad: por primera vez generación de energías renovables supera a las de carbón.,” 2022. https://www.elmostrador.cl/destacado/2022/10/25/chile-da-un-paso-firme-en-sustentabilidad-por-primera-vez-generacion-de-energias-renovables-superan-a-la-de-carbon/.
[19] D. I. MANOLAS, V. A. RIZIOTIS, G. P. PAPADAKIS, AND S. G. VOUTSINAS, “Hydro-servo-aero-elastic analysis of floating offshore wind turbines,” Fluids, vol. 5, no. 4, 2020, doi: 10.3390/fluids5040200.
[20]Equinor ASA, “HyWind Scotland - the world’s first floating wind farm.” https://www.equinor.com/energy/hywind-scotland.
[21] Principle Power, “The WindFloat® -Principle Power. Inc.,” 2022. https://www.principlepower.com/windfloat.
[22] Glosten, “PelaStar - Glosten,” 2022. https://glosten.com/project/pelastar/.
[23] energy.gov, “Offshore Floating Vertical-Axis Wind Turbine Project Identifies Promising Platform Design,” 2017. https://www.energy.gov/eere/wind/articles/offshore-floating-vertical-axis-wind-turbine-project-identifies-promising.
[24] J. M. J. JOURNÉE AND W. W. MASSIE, OFFSHORE HYDROMECHANICS, 2nd ed. 2001.